Comparative Study
. 2010 Sep;104(3):1267-85.
doi: 10.1152/jn.00675.2009. Epub 2010 Jul 7.

Spatial updating in monkey superior colliculus in the absence of the forebrain commissures: dissociation between superficial and intermediate layers

Affiliations
Comparative Study

Spatial updating in monkey superior colliculus in the absence of the forebrain commissures: dissociation between superficial and intermediate layers

Catherine A Dunn et al. J Neurophysiol. 2010 Sep.

Abstract

In previous studies, we demonstrated that the forebrain commissures are the primary pathway for remapping from one hemifield to the other. Nonetheless, remapping in lateral intraparietal cortex (LIP) across hemifield is still present in split brain monkeys. This finding indicates that a subcortical structure must contribute to remapping. The primary goal of the current study was to characterize remapping activity in the superior colliculus in intact and split brain monkeys. We recorded neurons in both the superficial and intermediate layers of the SC. We found that across-hemifield remapping was reduced in magnitude and delayed compared with within-hemifield remapping in the intermediate layers of the SC in split brain monkeys. These results mirror our previous findings in area LIP. In contrast, we found no difference in the magnitude or latency for within- compared with across-hemifield remapping in the superficial layers. At the behavioral level, we compared the performance of the monkeys on two conditions of a double-step task. When the second target remained within a single hemifield, performance remained accurate. When the second target had to be updated across hemifields, the split brain monkeys' performance was impaired. Remapping activity in the intermediate layers was correlated with the accuracy and latency of the second saccade during the across-hemifield trials. Remapping in the superficial layers was correlated with latency of the second saccade during the within- and across-hemifield trials. The differences between the layers suggest that different circuits underlie remapping in the superficial and intermediate layers of the superior colliculus.


Figures

Fig. 1.
Fig. 1.
Spatial configurations for across and within remapping. The exact configuration of the task is determined by the location of the receptive field. In this hypothetical example, the neuron is in the left hemisphere (gray asterisk) with a receptive field in the upper right visual field (circle). A: across-hemifield condition. The stimulus is flashed in the left visual field and is represented by neurons in the right hemisphere (black asterisk). When the eyes move to the target (T1), the location where the stimulus had been presented is now in the right visual field. The memory of the stimulus is represented by neurons in the left hemisphere (gray asterisk). B: within-hemifield condition. The stimulus appears in the right visual field. It is represented by neurons in the left hemisphere (black asterisk). After the saccade to T1, the location where the stimulus had been presented is still in the left hemisphere. Modified from Heiser et al. (2005).
Fig. 2.
Fig. 2.
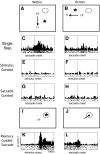
Intermediate layer superior colliculus (SC) neuron from a split brain monkey. A and B: stimulus and target locations for the single-step task. The monkey makes an eye movement (→) from the original fixation location (FP) to the target (T1). ○, the neuron's receptive field (RF). Before the eye movement is initiated, a stimulus (*) is flashed outside the RF. A: within condition. A stimulus is flashed in the same hemifield as the RF. The monkey makes a vertical saccade, shifting the RF to the location where the stimulus was presented. B: across condition. The stimulus is flashed in the hemifield opposite the RF. The monkey makes a horizontal saccade shifting the RF to the location where the stimulus was presented. In both configurations, the stimulus is extinguished before saccade onset. C–H, K, and L: histograms represent the average firing rate of the neuron aligned on stimulus onset (E, F, and K) or saccade onset (C, D, G, H, and L). Raster plots show the time of individual action potentials for each trial. Neuronal firing increases during the single-step task for both within (C) and across (D) conditions. Firing does not increase for the stimulus control conditions (E and F) or saccade control conditions (G and H). I and J: during the memory-guided saccade task, the monkey fixates while a stimulus is briefly presented inside the RF of the neuron (I). After a delay period, the FP is extinguished and the monkey makes a saccade to the remembered location of the stimulus (J). K and L: this neuron shows a strong visual response to stimulus onset and an ongoing response during the delay period (K) as well as increased activity at saccade onset (L).
Fig. 3.
Fig. 3.
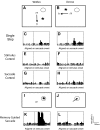
Superficial layer SC neuron from a split brain monkey. A and B: single-step task. This neuron has significant remapping activity during the single-step task for both the within (C) and across (D) conditions. The firing of the neuron is not significantly different from baseline for stimulus control conditions (E and F) or saccade control conditions (G and H). I and J: in the memory-guided saccade task, this neuron has a strong visual response (K) but no delay period or saccade related activity (L). Conventions for histograms same as in Fig. 2.
Fig. 4.
Fig. 4.
Response magnitude for within vs. across remapping. Each point represents data from a single neuron that has a significant response in ≥1 remapping condition. Remapping magnitude is calculated as the difference between activity in the single-step and saccade control tasks. If activity in the saccade control task is greater, remapping response is negative. A and B: in the superficial layers of split brain and intact monkeys, there is no difference in response magnitude for within- vs. across-hemifeld remapping. C: in the intermediate layers of split brain monkeys, more points lie above the unity line, indicating stronger remapping for within- than for across-hemifeld trials. D: in the intermediate layers of the intact monkey, no difference is seen in response magnitude for within versus across-hemifield remapping. Blue points: cells remap both within and across-hemifields. Green points: cells remap only within-hemifield. Red points: cells remap only across-hemifield.
Fig. 5.
Fig. 5.
Within-across (WA) remapping index distributions. Positive WA indices indicate stronger remapping activity during within compared with across conditions. A and B: the WA index distribution for superficial layers is not biased toward within or across conditions for either split brain or intact monkeys. C and D: intermediate layers. Split brain monkeys have a greater number of cells with positive WA indices (C). This indicates that most cells in these layers exhibit greater remapping activity during within compared with across conditions. In the intermediate layers of the SC of the intact monkey, the WA distribution is not biased toward positive or negative WA values (D).
Fig. 6.
Fig. 6.
Proportion of neurons with significant predictive and presaccadic remapping for within- and across-hemifield conditions. Predictive neurons began their remapping response before the visual latency of the neuron in the memory-guided saccade task. Presaccadic neurons are the subset of predictive neurons in which remapping is observed before saccade onset. A and B: in the superficial layers of the SC, an equal proportion of neurons show significant predictive (▨) and presaccadic (■) remapping for within and across conditions. C: in the intermediate layers of split brain monkeys, a lower proportion of neurons show significant presaccadic remapping for across versus within conditions. D: in the intermediate layers of the intact monkey, more neurons have predictive and presaccadic remapping for across conditions.
Fig. 7.
Fig. 7.
Neural latency for within vs. across remapping in intermediate layers. Latency is defined as time from significant neural remapping response onset to saccade onset. Negative values indicate presaccadic remapping. Only neurons with both within and across remapping responses are shown. A: in the intermediate layers of the SC in the split brain monkeys, remapping during across conditions occurs later than remapping during within conditions. B: in the intact animal, remapping latency is equal for within and across conditions.
Fig. 8.
Fig. 8.
Receiver operating characteristic (ROC) analysis of remapping activity for within- and across-hemifield trials. —, the sliding ROC value across cells aligned on saccade onset. ROC values are calculated in consecutive 50 ms bins every 10 ms across all neurons in each category. ROC values >0.5 indicate that activity is stronger on within trials than across trials. ROC values of 0.5 indicate that activity is equal during within and across trials. - - - above 0.5, the 95th percentile; - - - below 0.5, the 5th percentile as determined by bootstrap analysis (see methods). ROC values were not calculated from time 0 to 50 ms due to effects of saccadic suppression. A: in the superficial layers of the split brain monkeys, ROC values do not significantly deviate from chance. B: in the superficial layers of intact monkeys, a brief deviation below the 5th percentile boundary is observed shortly after saccade onset. C: in the intermediate SC in split brain animals, ROC values go well above the 95th percentile both before and after the saccade. D: intact animals exhibit ROC values below the 5th percentile just before saccade onset in the intermediate layers.
Fig. 9.
Fig. 9.
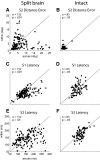
Distance error and saccade latency during double-step task. Each point represents the average behavior during 1 recording session for within vs. across conditions. Error is defined as the difference in degrees of visual angle between S2 endpoint and 2nd saccade target location. S1 latency is defined as time between target 1 onset and saccade initiation. S2 latency is the time from S1 end to S2 initiation. Split brain monkeys demonstrate significantly more error (A) and greater 1st (C) and 2nd (E) saccade latencies for across compared with within conditions. No significant difference is observed in error (B), 1st saccade (D), or 2nd saccade (F) latency for the intact monkey during within vs. across conditions. S1: saccade 1, to 1st target. S2: saccade 2, to 2nd target.
Fig. 10.
Fig. 10.
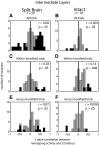
Trial-by-trial analysis for intermediate layers: relationship between remapping activity and second saccade (S2) distance error. Panels show the distribution of r values for the trial-by-trial correlation between remapping activity of intermediate layer SC neurons and S2 error. Vertical lines indicate r = 0. Note that only for split brain monkeys during across-hemifield trials (E) is the distribution of r values significantly shifted from 0. Negative r values indicate that greater remapping activity led to lower S2 error, whereas positive values indicate the opposite. Top: data for all trials. Middle: within-hemifield trials only. Bottom: across-hemifield trials only.
Fig. 11.
Fig. 11.
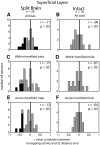
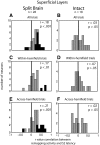
Trial-by-trial analysis for superficial layers: relationship between remapping activity and 2nd saccade (S2) distance error. Panels show the distribution of r values for the trial-by-trial correlation between remapping activity from the superficial layers of the SC and S2 error. Only for split brain monkeys during within-hemifield trials (C) is the distribution of r values significantly shifted from 0. Conventions same as in Fig. 10.
Fig. 12.
Fig. 12.
Trial-by-trial analysis for intermediate layers: relationship between remapping activity and 2nd saccade (S2) latency. Panels show the distribution of r values for the trial-by-trial correlation between remapping activity from the intermediate layers of the SC and the latency of the S2. In split brain monkeys, the distribution of r values significantly shifted from 0 during across-hemifield trials only (E). In the intact monkeys, the distribution of r values significantly shifted from 0 during within-hemifield trials only (D). Conventions same as in Fig. 10.
Fig. 13.
Fig. 13.
Trial-by-trial analysis for superficial layers: relationship between remapping activity and 2nd saccade (S2) latency. Panels show the distribution of r values for the trial-by-trial correlation between remapping activity from the superficial layers of the SC and the latency of the S2. The distribution of r values are significantly shifted from 0 for the split brain animals only for all trials (A, C, and E). Conventions same as in Fig. 10.

References

    1. Andersen RA, Asanuma C, Essick G, Siegel RM. Corticocortical connections of anatomically and physiologically defined subdivisions within the inferior parietal lobule. J Comp Neurol 296: 65–113, 1990 - PubMed
    1. Antonetty CM, Webster KE. The organization of the spinotectal projection. An experimental study in the rat. J Comp Neurol 163: 449–465, 1975 - PubMed
    1. Baizer JS, Bender DB. Comparison of saccadic eye movements in humans and macaques to single-step and double-step target movements. Vision Res 29: 485–495, 1989 - PubMed
    1. Baker J, Gibson A, Glickstein M, Stein J. Visual cells in the pontine nuclei of the cat. J Physiol 255: 415–433, 1976 - PMC - PubMed
    1. Basso MA, Liu P. Context-dependent effects of substantia nigra stimulation on eye movements. J Neurophysiol 97: 4129–4142, 2007 - PubMed

Publication types

LinkOut - more resources