. 2010 Sep;299(3):R823-31.
doi: 10.1152/ajpregu.00544.2009. Epub 2010 Jul 7.

Increased cyclooxygenase-2 expression and prostaglandin E2 production in pressurized renal medullary interstitial cells

Affiliations

Increased cyclooxygenase-2 expression and prostaglandin E2 production in pressurized renal medullary interstitial cells

Inge Carlsen et al. Am J Physiol Regul Integr Comp Physiol. 2010 Sep.

Abstract

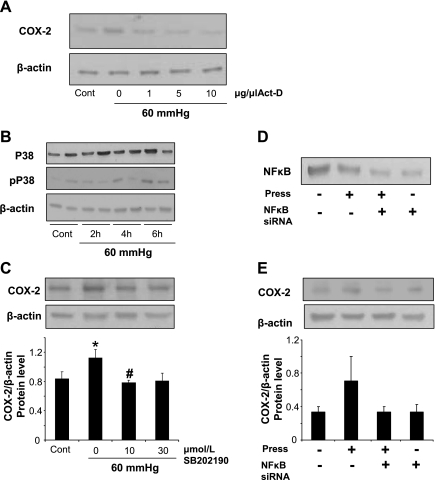
Renal medullary interstitial cells (RMICs) are subjected to osmotic, inflammatory, and mechanical stress as a result of ureteral obstruction, which may influence the expression and activity of cyclooxygenase type 2 (COX-2). Inflammatory stress strongly induces COX-2 in RMICs. To explore the direct effect of mechanical stress on the expression and activity of COX-2, cultured RMICs were subjected to varying amounts of pressure over time using a novel pressure apparatus. COX-2 mRNA and protein were induced following 60 mmHg pressure for 4 and 6 h, respectively. COX-1 mRNA and protein levels were unchanged. PGE(2) production in the RMICs was increased when cells were subjected to 60 mmHg pressure for 6 h and was prevented by a selective COX-2 inhibitor. Pharmacological inhibition indicating that pressure-induced COX-2 expression is dependent on p38 MAPK and biochemical knockdown experiments showed that NF-kappaB might be involved in the COX-2 induction by pressure. Importantly, terminal deoxyneucleotidyl transferase-mediated dUTP nick-end labeling and methylthiazoletetetrazolium assay studies showed that subjecting RMICs to 60 mmHg pressure for 6 h does not affect cell viability, apoptosis, and proliferation. To further examine the regulation of COX-2 in vivo, rats were subjected to unilateral ureteral obstruction (UUO) for 6 and 12 h. COX-2 mRNA and protein level was increased in inner medulla in response to 6- and 12-h UUO. COX-1 mRNA and protein levels were unchanged. These findings suggest that in vitro application of pressure recapitulates the effects on RMICs found after in vivo UUO. This directly implicates pressure as an important regulator of renal COX-2 expression.


Figures

Fig. 1.
Fig. 1.
Cyclooxygenase type 2 (COX-2) protein level in renal medullary interstitial cells (RMICs) subjected to treatment with IL-1β and FBS. All Western blots were reacted with anti-COX-2 antibody and revealed a 72-kDa band. A total of 20 μg protein was used for the COX-2 assay. All results are representative of 4 similar experiments. A: COX-2 protein abundance in RMICs in response to different concentrations of IL-1β (0.5, 1, 5, 10, 20 ng/ml) for 6 h. Increased COX-2 protein was observed at 5 ng/ml of IL-1β and stays elevated at 10 and 20 ng/ml as well. B: COX-2 protein abundance in RMICs as result of time-dependent IL-1β stimulation (5 ng/ml) for 0, 2, 4, 6, 8, 12, and 24 h. C: COX-2 protein abundance in RMICs grown in medium with and without FBS as well as subjected to administration of 5 ng/ml of IL-1β for 6 h. RMICs cultured in serum-free medium for 24 h prior to IL-1β treatment for 6 h showed increased COX-2 protein level, whereas cells subjected to medium with 10% FBS or serum-free media for 48 h did not show any change in COX-2. D: COX-2 immunocytochemistry in RMICs cultures. COX-2 immunoreactivity (green) is present in the cytoplasma of RMICs. As a nuclear marker DAPI (blue) was used. Scale bar = 50 μM.
Fig. 2.
Fig. 2.
COX-2 mRNA and protein level in RMICs in response to pressure. A: quantitative PCR (QPCR) for COX-2 and β-actin in RMICs. QPCR was performed using 100 ng cDNA. Increased COX-2 mRNA abundance, normalized to β-actin, was shown in response to 4-h 60 mmHg pressure and remained enhanced. *P < 0.05 compared with control (n = 6). B: immunoblot was reacted with anti-COX-2 antibody and revealed a 72-kDa band. A total of 20 μg protein was used for the COX-2 assay. Densitometric analysis demonstrated increased COX-2 protein level normalized to β-actin in RMICs subjected to 60 mmHg for 6 and 8 h. Each column represents the mean ± SE. *P < 0.05 compared with control (n = 6). C: COX-2 protein abundance in RMICs exposed to various pressure, from 30–120 mmHg showing increased COX-2 protein level in cells subjected to 60 and 90 mmHg pressure for 6 h (n = 3). D: inducible nitric oxide synthase (iNOS) protein abundance in RMICs in response to 60 mmHg pressure over time (0, 2, 4, 6, and 8 h), demonstrating increased iNOS protein level in cells subjected to pressure (n = 3).
Fig. 3.
Fig. 3.
COX-1 mRNA and protein level in RMICs in response to pressure. A: QPCR for COX-1 and β-actin in RMICs through pressure stimulation. QPCR was performed using 100 ng cDNA and illustrated unchanged COX-1 mRNA abundance normalized to β-actin. B: immunoblot was reacted with anti-COX-1 antibody and revealed a 71-kDa band. A total of 10 μg protein was used for the COX-1 assay. Densitometric analysis demonstrated unchanged COX-1 protein level normalized to β-actin in RMICs subjected to 60 mmHg for 6 h. Each column represents the mean ± SE.
Fig. 4.
Fig. 4.
PGE2 production in response to 60 mmHg pressure and IL-1β treatment in RMICs with and without the COX-2-specific inhibitor parecoxib. A: PGE2 production was increased in RMICs in response to 60 mmHg pressure for 6 h, and administration of a specific COX-2 inhibitor parecoxib attenuated this increase. Each bar represents the mean ± SE of 5 experiments. *P < 0.05 compared with control; #P < 0.05 parecoxib-treated pressurized RMICs compared with untreated pressurized RMICs. B: PGE2 production was increased in RMICs in response to IL-1β treatment for 6 and 24 h, and administration of a specific COX-2 inhibitor parecoxib attenuated this increase. Each bar represents the mean ± SE of 4 experiments. *P < 0.05 compared with control; #P < 0.05 parecoxib-treated IL-1β stimulated RMICs compared with untreated IL-1β stimulated RMICs.
Fig. 5.
Fig. 5.
Signaling pathways involved in COX-2 induction in RMICs subjected to 60 mmHg pressure. A: COX-2 protein abundance in pressurized RMICs stimulated with increasing doses of the transcription factor actinomycin-D (Act-D; 0–10 μg/μl). The pressurized induction of COX-2 was abolished when actinomycin D was used (n = 3). B: P38 and pP38 protein abundance normalized to β-actin in RMICs in response to 60 mmHg pressure for 2, 4, and 6 h. Increased phosphorylation of P38 was observed in response to 6 h of pressure (n = 4). C: pressurized RMICs were incubated with the p38 MAPK inhibitor SB202190 (10 and 30 μM), and immunoblot illustrates that p38 inhibition reduced the COX-2 induction. Each column represents the mean ± SE of 3 experiments. *P < 0.05 pressurized RMICs compared with control; #P < 0.05 pressurized RMICs: SB202190 compared with vehicle-treated cells. D: transfection of RMICs with siRNA directed against NF-κB reduced NF-κB level by 80% (n = 5). E: pressurized RMICs were transfected with siRNA against NF-κB, and immunoblot shows attenuation of the COX-2 induction. Each bar represents the mean ± SE of 5 experiments.
Fig. 6.
Fig. 6.
Effect of 60 mmHg pressure on cell death, viability, and apoptosis in RMICs. A: %dead RMICs in response to 60 mmHg pressure for 6 h. B: apoptotic RMICs (brown stain) were determined by terminal deoxyneucleotidyl transferase-mediated dUTP nick-end labeling assay, and no change was detected between control and pressurized cells. C: cells viability was determined by methylthiazoletetetrazolium (MTT) assay, and no change was detected between control and pressurized RMICs. D: RMICs were treated with hydrogen peroxide and showed increased cells dead by 5 mM of hydrogen peroxide. White bars represented alive RMICs and black bars represented dead RMICs. *P < 0.05 compared with dead cells. Data are expressed as means ± SE of 4 experiments.
Fig. 7.
Fig. 7.
Expression of COX-2 and COX-1 mRNA and protein in inner medulla tissue from sham-operated rats and rats subjected to unilateral ureteral obstruction (UUO) for 6 and 12 h. A: representative QPCR for COX-2, COX-1, and TATA box-binding protein. QPCR was performed using 100 ng cDNA. COX-2 mRNA expression was increased in response to 6- and 12-h UUO in inner medulla. COX-1 mRNA level was unchanged. Each column represents the mean ± SE. *P < 0.05 Obstr. compared with sham rats; #P < 0.05 Obstr. compared with non-obstr. B: immunoblot was reacted with anti-COX-2 antibody and anti-COX-1 antibody. A total of 20 μg protein was used for the COX assay. Densitometric analyses of all the samples from sham-operated and obstructed kidneys of rats with 6- and 12-h UUO revealed that there was an increase of COX-2 protein level in the UUO group compared with sham-operated rats. COX-1 protein level was unchanged. *P < 0.05 Obstr. compared with sham rats; #P < 0.05 Obstr. Compared with non-obstr (n = 6).

References

    1. Akai Y, Homma T, Burns KD, Yasuda T, Badr KF, Harris RC. Mechanical stretch/relaxation of cultured rat mesangial cells induces protooncogenes and cyclooxygenase. Am J Physiol Cell Physiol 267: C482–C490, 1994 - PubMed
    1. Akarasereenont P, Techatrisak K, Chotewuttakorn S, Thaworn A. The induction of cyclooxygenase-2 in IL-1β-treated endothelial cells is inhibited by prostaglandin E2 through cAMP. Mediators Inflamm 8: 287–294, 1999 - PMC - PubMed
    1. Barrios-Rodiles M, Chadee K. Novel regulation of cyclooxygenase-2 expression and prostaglandin E2 production by IFN-γ in human macrophages. J Immunol 161: 2441–2448, 1998 - PubMed
    1. Broadbelt NV, Stahl PJ, Chen J, Mizrahi M, Lal A, Bozkurt A, Poppas DP, Felsen D. Early upregulation of iNOS mRNA expression and increase in NO metabolites in pressurized renal epithelial cells. Am J Physiol Renal Physiol 293: F1877–F1888, 2007 - PubMed
    1. Campean V, Theilig F, Paliege A, Breyer M, Bachmann S. Key enzymes for renal prostaglandin synthesis: site-specific expression in rodent kidney (rat, mouse). Am J Physiol Renal Physiol 285: F19–F32, 2003 - PubMed

Publication types

MeSH terms