. 2010 Aug;69(8):850-63.
doi: 10.1097/NEN.0b013e3181eac1f5.

Early progenitor cell marker expression distinguishes type II from type I focal cortical dysplasias

Affiliations

Early progenitor cell marker expression distinguishes type II from type I focal cortical dysplasias

Ksenia A Orlova et al. J Neuropathol Exp Neurol. 2010 Aug.

Abstract

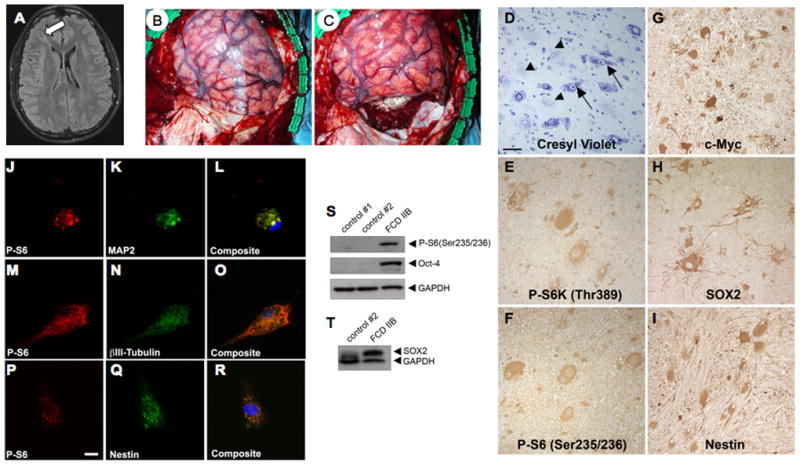
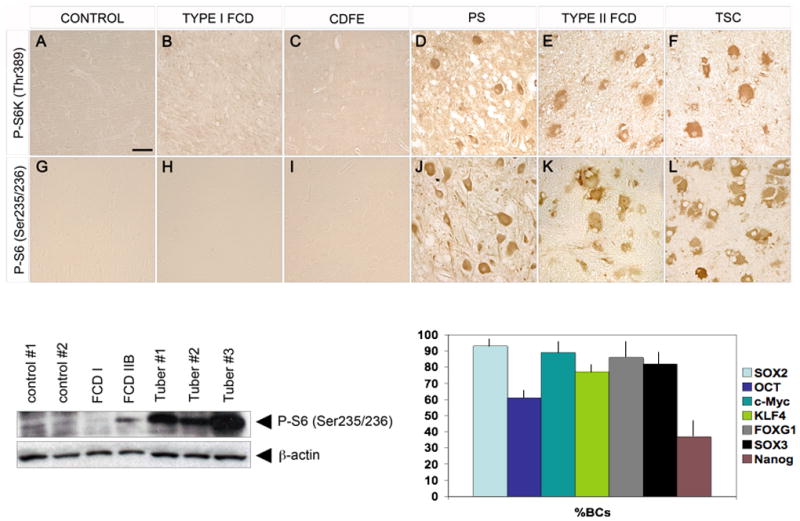
Type I and type II focal cortical dysplasias (FCDs) exhibit distinct histopathologic features that suggest different pathogenic mechanisms. Type I FCDs are characterized by mild laminar disorganization and hypertrophic neurons, whereas type II FCDs exhibit dramatic laminar disorganization and cytomegalic cells (balloon cells). Both FCD types are associated with intractable epilepsy; therefore, identifying cellular or molecular differences between these lesion types that explains the histologic differences could provide new diagnostic and therapeutic insights. Type II FCDs express nestin, a neuroglial progenitor protein that is modulated in vitro by the stem cell proteins c-Myc, sex-determining region Y-box 2 (SOX2), and Octamer-4 (Oct-4) after activation of mammalian target of rapamycin complex 1 (mTORC1). Because mTORC1 activation has been demonstrated in type II FCDs, we hypothesized that c-Myc, SOX2, and Oct-4 expression would distinguish type II from type I FCDs. In addition, we assayed the expression of progenitor cell proteins forkhead box G1 (FOXG1), Kruppel-like factor 4 (KLF4), Nanog, and SOX3. Differential expression of 7 stem cellproteins and aberrant phosphorylation of2mTORC1 substrates, S6 andS6 kinase 1 proteins, clearly distinguished type II from type I FCDs(n = 10 each). Our results demonstrate new potential pathogenic pathways in type II FCDs and suggest biomarkers for diagnostic pathology in resected epilepsy specimens.


Figures

Figure 1
Figure 1
Schematic of mTORC1 signaling and genetic mutations at specific sites in the pathway. Cytoplasmic mTOR signaling is activated in normal cells by growth factors and nutrients. Loss-of-function mutations in either TSC1 or TSC2 lead to constitutive mTORC1 signaling and cause tuberous sclerosis complex (TSC). Loss-of-function deletions in STRADa cause polyhydramnios, megalencephaly, symptomatic epilepsy syndrome (PS) and result in hypoactivation of the TSC1:TSC2 complex and enhanced mTORC1 signaling. Hyperactive mTORC1 signaling results in enhanced S6K1 and S6 phosphorylation, leading to increased cell size, such as balloon cells (BCs) and giant cells (GCs). mTORC1 mediated inhibition of 4E-BP1 results in enhanced translation of c-Myc, which in turn translocates into the nucleus to regulate expression of Octamer-4 (Oct-4), sex-determining region Y box 2 (SOX2), and nestin, perhaps conferring an immature cellular phenotype on many type II focal cortical dysplasia (FCD) cells. The molecular event causing sporadic FCD type II has yet to be identified but the phenotypic and histological similarities between sporadic FCD II, PS, and TSC suggest that sporadic FCD type II may be caused by dysfunction of an mTORC1 regulatory gene.
Figure 2
Figure 2
Hyperactive mTORC1 signaling and progenitor cell marker protein expression in rapidly processed, surgically resected type IIB focal cortical dysplasia (FCD). (A) Axial FLAIR MRI of a 14-year-old male patient with intractable epilepsy demonstrating a cortical dysplasia extending from the right frontal horn of the lateral ventricle to the right frontal cortex (arrow). (B, C) Intra-operative photographs showing pre-operative (B) and post-operative (C) images of the focal cortical dysplasia depicted radiographically in (A). (D-I) Histology and immunohistochemistry of the resected FCD IIB demonstrating numerous balloon cells (BCs) (arrowheads) and dysmorphic neurons (arrows) in a cresyl violet-stained section (D), enhanced immunoreactivity for mTORC1 signaling proteins phospho-p70S6Kinase (P-S6K1) (E), phospho-ribosomal S6 (P-S6) (F), and c-Myc (G), and expression of sex-determining region Y-box 2 (SOX2) (H) and nestin (I) by BCs and dysmorphic neurons (20x objective, scale bar = 50 mm). (J-R) Cells cultured from the resected FCD IIB specimen express microtubule associated protein-2 (MAP2) and β-III tubulin (K, N) and nestin (Q) and are highly immunoreactive for P-S6 (J, M, P). Cells were co-stained with Hoechst (L, O, R) to visualize the nuclei. Note the abnormal morphology of the cells and laterally displaced nuclei (L, O). Scale bar = 10 mm. (S, T) Representative Western blot analysis of whole tissue lysates from epilepsy control cortex (control #1), postmortem control cortex (control #2), and the FCD IIB specimen. FCD IIB demonstrates enhanced P-S6, Octamer-4 (Oct-4) (S), and SOX2 (T) expression vs. the control samples. Glyceraldehyde phosphate dehydrogenase (GAPDH) served as an internal loading control.
Figure 3
Figure 3
Sex-determining region Y-box 2 (SOX2) is expressed in polyhydramnios, megalencephaly, symptomatic epilepsy syndrome (PS), type II focal cortical dysplasia (FCD), and tuberous sclerosis complex (TSC) but not in control, type I FCD, or cortical dysplasia focal epilepsy (CDFE) cortex. (A-F) SOX2 expression detected by immunohistochemistry in neocortical brain tissue samples (large panel photos, 5x objective; bar = 200 mm; inset photos, 40x objective; bar = 50 mm). SOX2 expression is virtually absent in control (A), type I FCD (B), and CDFE2 (C) cases and abundant in PS (D), type II FCD (E), and TSC (F). Bottom left, Western blot analysis of SOX2 expression in tissue lysates from postmortem control cortex, FCD IIB, and 2 tuber specimens. Glyceraldehyde phosphate dehydrogenase (GAPDH) served as an internal loading control. Bottom center, RT-PCR amplification of SOX2 transcripts (225 bp amplicon, arrow) from single microdissected SOX2+ balloon cells (BCs) in 2 FCD IIB specimens but not a pyramidal neuron from postmortem control cortex. First lane is size marker. Bottom right, cell counts of SOX2+ cells in postmortem (PM) control, epilepsy (Epi) control, type I FCD, and type II FCD specimens. Counts reflect mean cell number across 3 regions of interest per specimen; mean ± SEM, *p < 0.05).
Figure 4
Figure 4
Octamer-4 (Oct-4) is expressed in polyhydramnios, megalencephaly, symptomatic epilepsy syndrome (PS), type II focal cortical dysplasia (FCD), and tuberous sclerosis complex (TSC) but not in control, type I FCD, or cortical dysplasia focal epilepsy (CDFE) cortex. Immunohistochemistry for Oct-4 expression in neocortical brain tissue samples (large panel photos, 5x objective; bar = 200 mm; inset photos, 40x objective; bar = 50 mm). Oct-4 expression is virtually absent in postmortem control (A), type I FCD (B), and CDFE (C) cases and abundant in PS (D), type II FCD (E), and TSC (F). Bottom left, Western blot analysis of Oct-4 depicting enhanced expression in tissue lysates from FCD IIB and 2 tuber specimens compared with epilepsy control cortex (control #1) and postmortem control (control #2) cortex and FCD I. Glyceraldehyde phosphate dehydrogenase (GAPDH) served as an internal loading control. Bottom center, RT-PCR amplification of Oct-4 transcript (290 bp amplicon) from single microdissected SOX2-immunoreactive balloon cell (BC) in an FCD IIB specimen but not a pyramidal neuron from postmortem control cortex. Bottom right, cell counts of Oct-4+ cells in postmortem (PM) control, epilepsy (Epi) control, type I FCD, and type II FCD specimens. Counts reflect mean cell number across 3 regions of interest per specimen; mean ± SEM, *p < 0.05).
Figure 5
Figure 5
c-Myc expression is prominent in polyhydramnios, megalencephaly, symptomatic epilepsy syndrome (PS), type II focal cortical dysplasia (FCD), and tuberous sclerosis complex (TSC) but not control, type I FCD, or cortical dysplasia focal epilepsy (CDFE) cortex. c-Myc expression in neocortical brain tissue samples (large panel photos, 5x objective; bar = 200 mm; inset photos, 40x objective; bar = 50 mm). c-Myc immunoreactivity is virtually absent in control (A), type I FCD (B), and CDFE (C) cases and abundant in PS (D), type II FCD (E), and TSC (F). Bottom left, Western blot analysis of c-Myc showing enhanced expression in FCD IIB and tuber specimen compared with FCD I or postmortem control cortex. Bottom right, cell counts of c-Myc+ cells in postmortem (PM) control, epilepsy (Epi) control, type I FCD, and type II FCD specimens. Counts reflect mean cell number across 3 regions of interest per specimen; mean ± SEM, *p < 0.05).
Figure 6
Figure 6
Sex-determining region Y-box 3 (SOX3) (A-C) and Kruppel-like factor 4 (KLF4) (D-F) immunolabeling in control (A, D), type II focal cortical dysplasia (FCD) (B, E), and tuberous sclerosis complex (TSC) (C, F). Inset in (B) shows higher magnification image of SOX3 labeling. In (C), there are both SOX3 labeled (arrow) and unlabeled (arrowhead) cells. There is strong KLF4 labeling in type II FCD and tubers. SOX3 and KLF4 expression is absent in control cortex. Bar: A, B, D, F = 300 mm; C = 100 mm.
Figure 7
Figure 7
Forkhead box G1 (FOXG1) expression in control cortex, type I, and type II focal cortical dysplasia (FCD). Expression is absent in control and type I FCD specimens vs. strong protein immunoreactivity in type II FCD (large panel photos, 5x objective; bar = 200 mm; inset photos, 40x objective; bar = 50 mm).
Figure 8
Figure 8
Expression of Nanog in type II dysplasias. Nanog immunoreactivity is virtually absent in control (A), type I focal cortical dysplasia (FCD) (B), and cortical dysplasia focal epilepsy (CDFE) (C) cases and abundant in polyhydramnios, megalencephaly, symptomatic epilepsy syndrome (PS) (D), type II FCD (E), and tuberous sclerosis complex (TSC) (F) (large panel photos, 5x objective; bar = 200 mm; inset photos, 40x objective; bar = 50 mm).
Figure 9
Figure 9
mTRC1 activation distinguishes type I from type II focal cortical dysplasia (FCD) as evidenced by enhanced immunoreactivity for phospho-p70S6Kinase (P-S6K1; Thr389) and phospho-ribosomal S6 (P-S6; Ser235/236) in the latter. (A-H) Aberrant phosphorylation of S6K1 is prominent in polyhydramnios, megalencephaly, symptomatic epilepsy syndrome (PS) (D), type II FCD (E), and tuberous sclerosis complex (TSC) (F) but is virtually absent in postmortem control (A), type I FCD (B), and cortical dysplasia focal epilepsy (CDFE) (C) samples. Hyperphosphorylation of the S6K1 target S6 is evident in PS (J), type II FCD (K), and TSC (L) but is virtually absent in control (G), type I FCD (H), and CDFE (I) samples (20x objective, bar = 50 mm). Bottom left, Western blot analysis shows enhanced S6 protein phosphorylation in FCD IIB and 3 tuber specimens vs. FCD I, epilepsy control cortex (control #1) and postmortem control cortex (control #2). Bottom right, graph depicting percent of morphologically defined balloon cells (BCs) in sporadic type IIB FCD expressing each stem cell marker protein (± SEM).

References

    1. Palmini A, Najm I, Avanzini G, et al. Terminology and classification of the cortical dysplasias. Neurology. 2004;62:S2–8. - PubMed
    1. Krsek P, Maton B, Korman B, et al. Different features of histopathological subtypes of pediatric focal cortical dysplasia. Ann Neurol. 2008;63:758–69. - PubMed
    1. Fauser S, Huppertz HJ, Bast T, et al. Clinical characteristics in focal cortical dysplasia: A retrospective evaluation in a series of 120 patients. Brain. 2006;129:1907–16. - PubMed
    1. Andre VM, Flores-Hernandez J, Cepeda C, et al. NMDA receptor alterations in neurons from pediatric cortical dysplasia tissue. Cereb Cortex. 2004;14:634–46. - PubMed
    1. Crino PB, Nathanson KL, Henske EP. The tuberous sclerosis complex. N Engl J Med. 2006;355:1345–56. - PubMed

Publication types

MeSH terms