. 2010 May-Jun;15(3):036013.
doi: 10.1117/1.3431728.

Lookup-table method for imaging optical properties with structured illumination beyond the diffusion theory regime

Affiliations

Lookup-table method for imaging optical properties with structured illumination beyond the diffusion theory regime

Tim A Erickson et al. J Biomed Opt. 2010 May-Jun.

Abstract

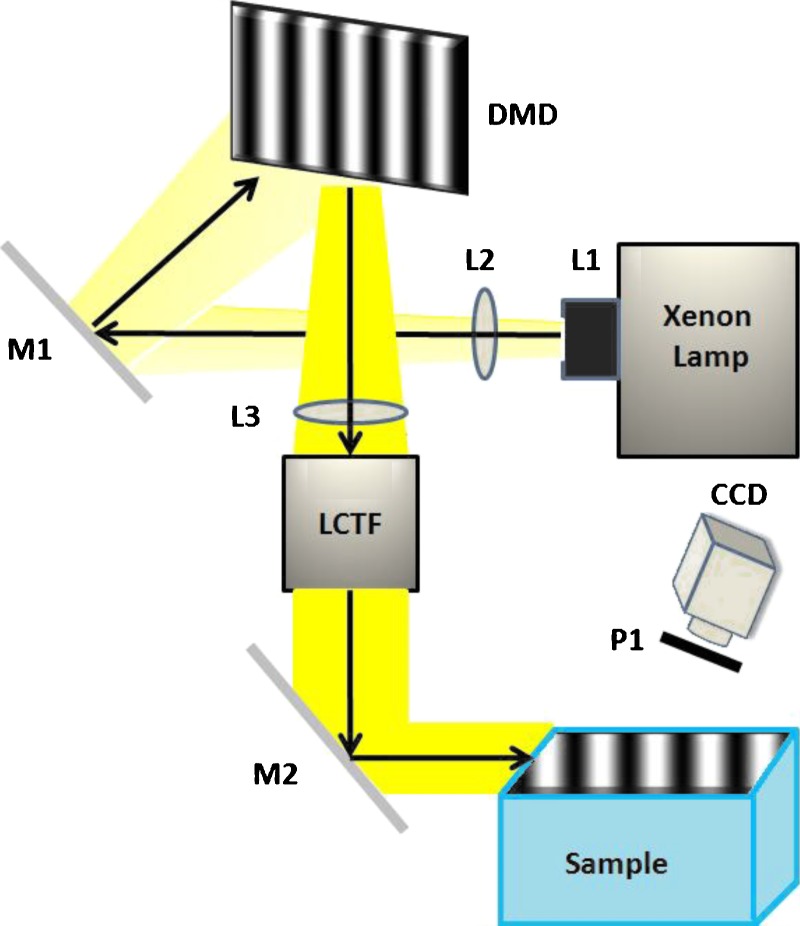
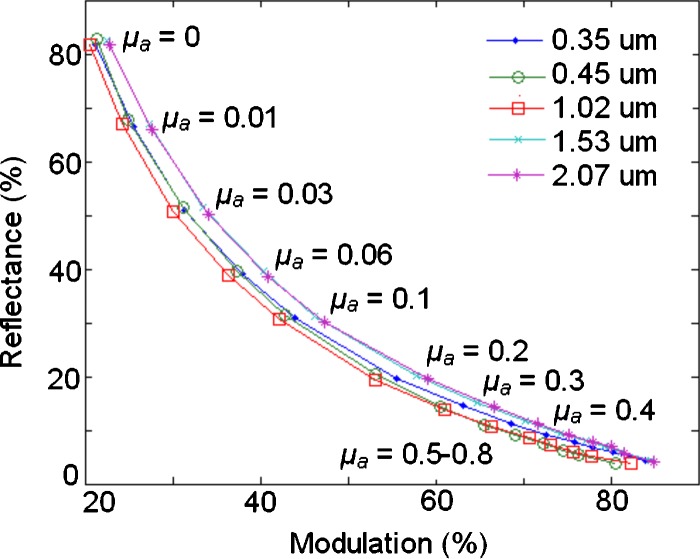
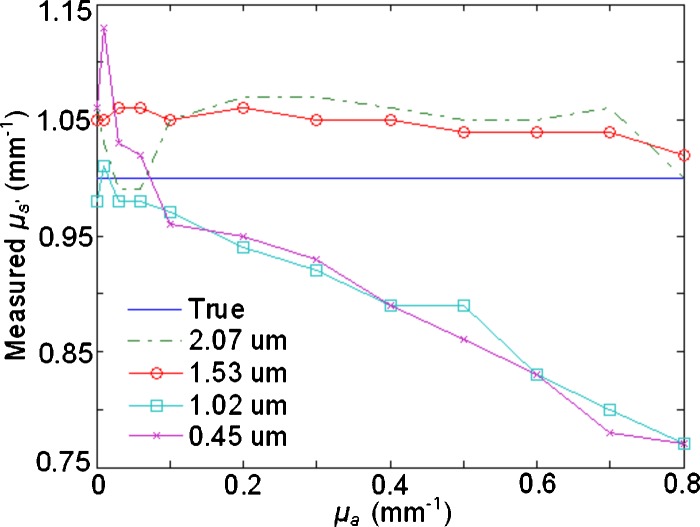
Sinusoidally structured illumination is used in concert with a phantom-based lookup-table (LUT) to map wide-field optical properties in turbid media with reduced albedos as low as 0.44. A key advantage of the lookup-table approach is the ability to measure the absorption (mu(a)) and reduced scattering coefficients (mu(s) (')) over a much broader range of values than permitted by current diffusion theory methods. Through calibration with a single reflectance standard, the LUT can extract mu(s) (') from 0.8 to 2.4 mm(-1) with an average root-mean-square (rms) error of 7% and extract mu(a) from 0 to 1.0 mm(-1) with an average rms error of 6%. The LUT is based solely on measurements of two parameters, reflectance R and modulation M at an illumination period of 10 mm. A single set of three phase-shifted images is sufficient to measure both M and R, which are then used to generate maps of absorption and scattering by referencing the LUT. We establish empirically that each pair (M,R) maps uniquely to only one pair of (micro(s) ('),micro(a)) and report that the phase function (i.e., size) of the scatterers can influence the accuracy of optical property extraction.


Figures

Figure 1
Figure 1
Experimental setup: Light from the Xe lamp is reflected from the DMD and imaged onto the sample after passing through a liquid-crystal tunable filter (LCTF). The diffuse reflectance is captured by the CCD, which is positioned at a slight angle, in order to avoid the collection of specularly reflected photons.
Figure 2
Figure 2
Modulation∕reflectance LUT generated using a spatial illumination period of 10 mm. The line intersections are measured data points. The lines are generated by linearly interpolating between data points.
Figure 3
Figure 3
Absorption variation experiment. True (solid line) versus extracted values for the two-frequency modulation/reflectance LUT (circles), eight-frequency modulation/reflectance LUT (triangles), and SDA (squares).
Figure 4
Figure 4
Scattering variation experiment. True (solid line) versus extracted values for the two-frequency modulation/reflectance LUT (circles), eight-frequency modulation/reflectance LUT (triangles), and SDA (squares).
Figure 5
Figure 5
Effect of microsphere size on measured modulation M and reflectance R at a spatial period of 10 mm for samples with identical (μs,μa).
Figure 6
Figure 6
Effect of microsphere size on measured modulation M and reflectance R at a spatial period of 2 mm for samples with identical (μs,μa).
Figure 7
Figure 7
Phase function variation experiment. True (solid line) versus extracted μs values for 2.07 (dotted line), 1.53 (circles), 1.02 (squares), and 0.45 μm (exes) spheres versus μa.
Figure 8
Figure 8
Phase function variation experiment. True (solid line) versus extracted μa values for 2.07 (dotted line), 1.53 (circles), 1.02 (squares) and 0.45 μm (exes) spheres.
Figure 9
Figure 9
Effect of LUT spatial period on extracting μa (circles) and μs (squares).
Figure 10
Figure 10
(a) Raw dc reflectance image, the reflectance values of the star and surrounding medium are nearly identical and would thus appear indistinguishable to the naked eye. (b) Absorption map, the absorption coefficient in the star and surrounding medium are significantly different, and. (c) Scattering map, The scattering coefficient inside the star and surrounding medium are significantly different.

References

    1. Cuccia D., Bevilacqua F., Durkin A., Ayers F., and Tromberg B., “Quantitation and mapping of tissue optical properties using modulated imaging,” J. Biomed. Opt. 14(2), 024012 (Mar./Apr. 2009). 10.1117/1.3088140 - DOI - PMC - PubMed
    1. Cuccia D., Bevilacqua F., Durkin A., and Tromberg B., “Modulated imaging: quantitative analysis and tomography of turbid media in the spatial-frequency domain,” Opt. Lett. 30, 1354–1356 (2005). 10.1364/OL.30.001354 - DOI - PubMed
    1. Toublanc D., “Henyey-Greenstein and Mie phase functions in Monte Carlo radiative transfer computations,” Appl. Opt. 35, 3270–3274 (1996). 10.1364/AO.35.003270 - DOI - PubMed
    1. Ayers F., Cuccia D., Kelly K., and Durkin A., “Wide-field spatial mapping of in vivo tattoo skin optical properties using modulated imaging,” Lasers Surg. Med. 41, 442–453 (2009). 10.1002/lsm.20782 - DOI - PMC - PubMed
    1. Weber J., Cuccia D., Durkin A., and Tromberg B., “Noncontact imaging of absorption and scattering in layered tissue using spatially modulated structured light,” J. Appl. Phys. 105, 102028 (2009). 10.1063/1.3116135 - DOI

Publication types

Substances