. 2010 Nov;49(5):737-45.
doi: 10.1016/j.yjmcc.2010.06.006. Epub 2010 Jul 6.

Normal passive viscoelasticity but abnormal myofibrillar force generation in human hypertrophic cardiomyopathy

Affiliations

Normal passive viscoelasticity but abnormal myofibrillar force generation in human hypertrophic cardiomyopathy

Anita C Hoskins et al. J Mol Cell Cardiol. 2010 Nov.

Abstract

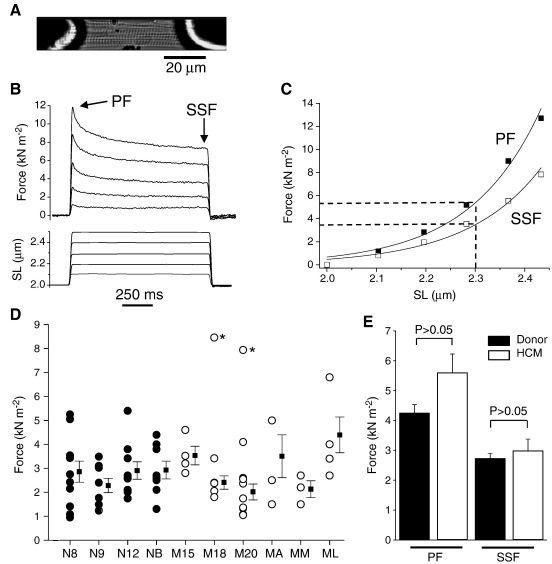
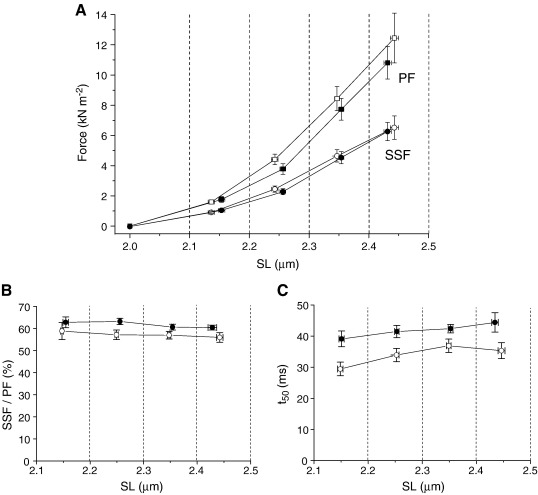
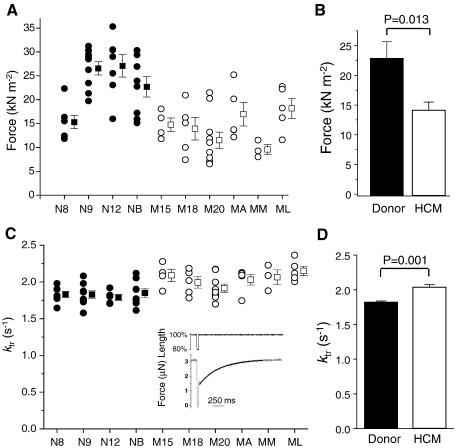
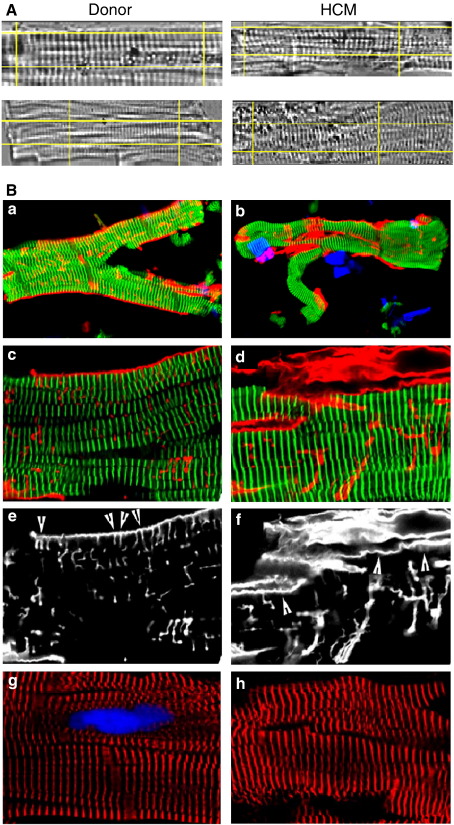
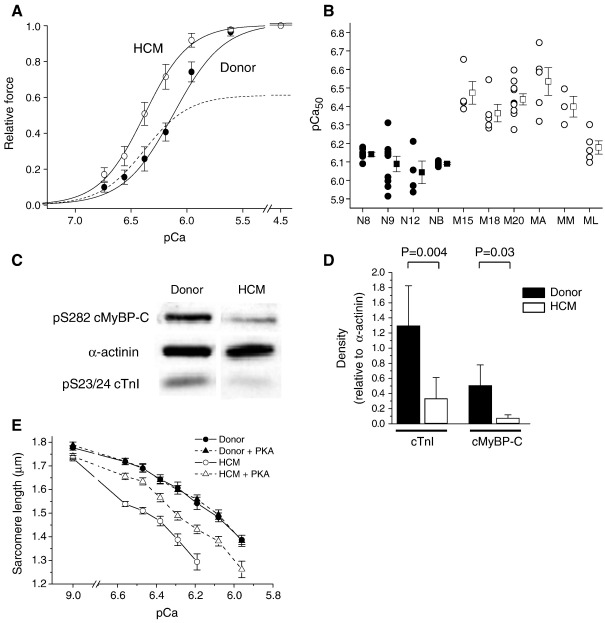
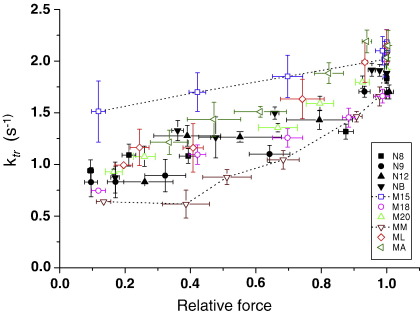
Hypertrophic cardiomyopathy (HCM) is characterized by left ventricular hypertrophy, increased ventricular stiffness and impaired diastolic filling. We investigated to what extent myocardial functional defects can be explained by alterations in the passive and active properties of human cardiac myofibrils. Skinned ventricular myocytes were prepared from patients with obstructive HCM (two patients with MYBPC3 mutations, one with a MYH7 mutation, and three with no mutation in either gene) and from four donors. Passive stiffness, viscous properties, and titin isoform expression were similar in HCM myocytes and donor myocytes. Maximal Ca(2+)-activated force was much lower in HCM myocytes (14 ± 1 kN/m(2)) than in donor myocytes (23 ± 3 kN/m(2); P<0.01), though cross-bridge kinetics (k(tr)) during maximal Ca(2)(+) activation were 10% faster in HCM myocytes. Myofibrillar Ca(2)(+) sensitivity in HCM myocytes (pCa(50)=6.40 ± 0.05) was higher than for donor myocytes (pCa(50)=6.09 ± 0.02; P<0.001) and was associated with reduced phosphorylation of troponin-I (ser-23/24) and MyBP-C (ser-282) in HCM myocytes. These characteristics were common to all six HCM patients and may therefore represent a secondary consequence of the known and unknown underlying genetic variants. Some HCM patients did however exhibit an altered relationship between force and cross-bridge kinetics at submaximal Ca(2+) concentrations, which may reflect the primary mutation. We conclude that the passive viscoelastic properties of the myocytes are unlikely to account for the increased stiffness of the HCM ventricle. However, the low maximum Ca(2+)-activated force and high Ca(2+) sensitivity of the myofilaments are likely to contribute substantially to any systolic and diastolic dysfunction, respectively, in hearts of HCM patients.


Figures

Fig. 1
Fig. 1
Passive force in skinned myocytes. (A) Typical donor skinned myocyte attached to the force transducer and servomotor. (B) Example of stretch protocol and force response. PF, peak force; SSF, steady-state force. (C) Force–SL extension curves in a typical myocyte. Stiffness was assessed from the force at SL = 2.3 μm. (D) Passive stiffness (here measured from steady-state force) in 33 individual myocytes from 4 donor hearts (filled circles) and 30 from 6 HCM hearts (open circles). Squares show mean ± SEM for each heart. Asterisks indicate myocytes excluded from the calculation of means. (E) Mean stiffness data from peak force and steady-state force measurements in human donor myocytes (n = 4) and HCM myocytes (n = 6).
Fig. 2
Fig. 2
Sarcomere length dependence of passive force and viscoelasticity in skinned donor myocytes (filled symbols) and HCM myocytes (open symbols). Data were grouped into 0.1-μm-wide ‘bins’ according to the SL reached during the length step and the averages were calculated for each heart. Symbols show mean ± SE from 4 donor and 6 HCM hearts. (A) Peak and steady-state forces. (B) Amplitude of force decay during stress relaxation, expressed as the steady-state force divided by the peak force. (C) Mean half-time of force decay (t50).
Fig. 3
Fig. 3
Isometric force and cross-bridge kinetics in skinned myocytes at maximal Ca2+ activation (pCa 4.5). (A) Data from individual myocytes (circles) and mean data (squares). Symbols as in Fig. 1. (B) Mean force data (n = 4 donor hearts and 6 HCM hearts). (C) Rate constant of force redevelopment (ktr). Inset: example of force redevelopment in a skinned donor myocyte after rapid release/restretch, and fitted single exponential curve. (D) Mean ktr data.
Fig. 4
Fig. 4
Structure of typical donor myocytes (patient N12) and HCM myocytes (patient M15). (A) Myocyte video images from the computer screen. (B) Confocal images using primary antibodies as follows: a–d (a and b overview; c and d high magnification), polyclonal rabbit anti-titin m8 to visualize the myofibrils (green), monoclonal mouse anti-collagen IV to stain for extracellular matrix (red), DAPI (blue) for nucleus; e and f, collagen IV (same field as c and d); g and h, sarcomeric α-actinin (red), nucleus (blue). HCM myocytes showed increased collagen IV around the myocytes but an absence of the regular arrangement of collagen IV seen on the surface of donor myocytes (compare arrowheads in e and f).
Fig. 5
Fig. 5
Ca2+ sensitivity of force in donor myocytes (filled symbols) and HCM myocytes (open symbols). (A) Mean force–pCa curves for the 4 donor patients (28 myocytes) and HCM patients (32 myocytes). Force was normalized to the maximum force (pCa 4.5). Dashed line shows the mean HCM curve factoring in the depression of maximum force. (B) Individual and mean pCa50 values for the individual patients. (C) Representative Western blots for phosphorylated cTnI (ser-23/24), cMyBP-C (ser-282) and α-actinin (loading control) in one donor and one HCM sample. (D) Mean data. (E) Mean shortening–pCa relationships in unrestrained myocytes (n = 14–16 myocytes per group).
Fig. 6
Fig. 6
Relationship between cross-bridge cycling kinetics and force in donor myocytes (filled symbols) and HCM myocytes (open symbols) at different levels of Ca2+ activation. Each point shows the force and ktr values (with standard errors) measured in myocytes from the same heart at each Ca2+ concentration. Averages of 4 donor hearts and 6 HCM hearts. The force–ktr relationships were similar in donor and HCM myocytes, except for myocytes from two HCM patients (dashed lines).

References

    1. Watkins H., Seidman J.G., Seidman C.E. Familial hypertrophic cardiomyopathy: a genetic model of cardiac hypertrophy. Hum Mol Genet. 1995;4:1721–1727. - PubMed
    1. Maron B.J. Hypertrophic cardiomyopathy: a systematic review. JAMA. 2002;287:1308–1320. - PubMed
    1. Elliott P., McKenna W.J. Hypertrophic cardiomyopathy. Lancet. 2004;363:1881–1891. - PubMed
    1. Van Driest S.L., Vasile V.C., Ommen S.R., Will M.L., Tajik A.J., Gersh B.J. Myosin binding protein C mutations and compound heterozygosity in hypertrophic cardiomyopathy. J Am Coll Cardiol. 2004;44:1903–1910. - PubMed
    1. Theis J.L., Bos J.M., Theis J.D., Miller D.V., Dearani J.A., Schaff H.V. Expression patterns of cardiac myofilament proteins—genomic and protein analysis of surgical myectomy tissue from patients with obstructive hypertrophic cardiomyopathy. Circ Heart Fail. 2009;2:325–333. - PMC - PubMed

Publication types