Comparative Study
. 2011 Jul 15;80(4):1015-22.
doi: 10.1016/j.ijrobp.2010.03.012. Epub 2010 Jul 7.

Proton stereotactic body radiation therapy for clinically challenging cases of centrally and superiorly located stage I non-small-cell lung cancer

Affiliations
Comparative Study

Proton stereotactic body radiation therapy for clinically challenging cases of centrally and superiorly located stage I non-small-cell lung cancer

Steven P Register et al. Int J Radiat Oncol Biol Phys. .

Abstract

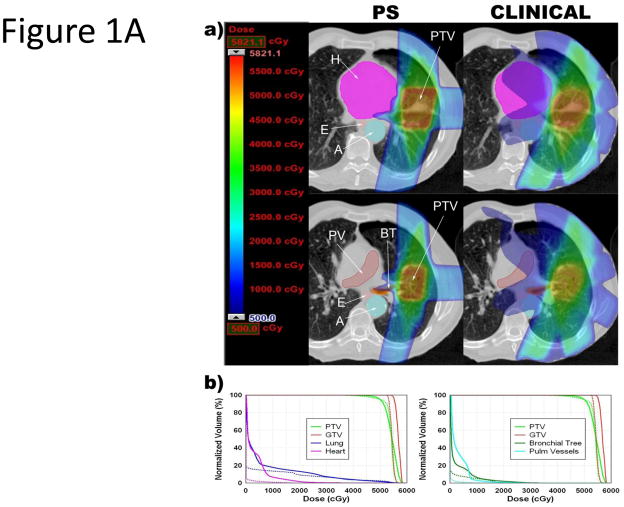
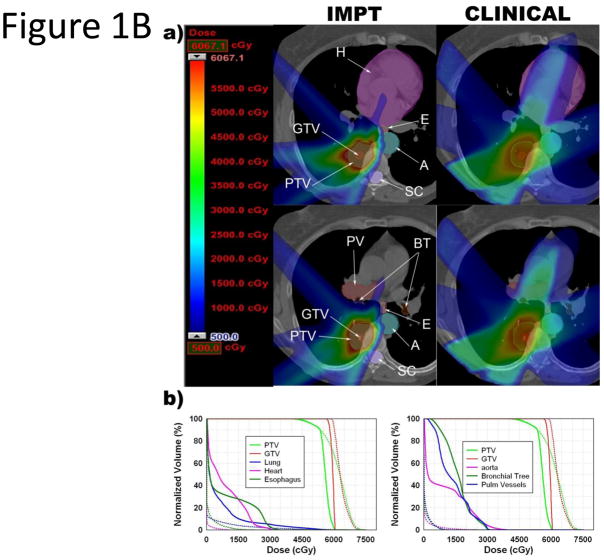
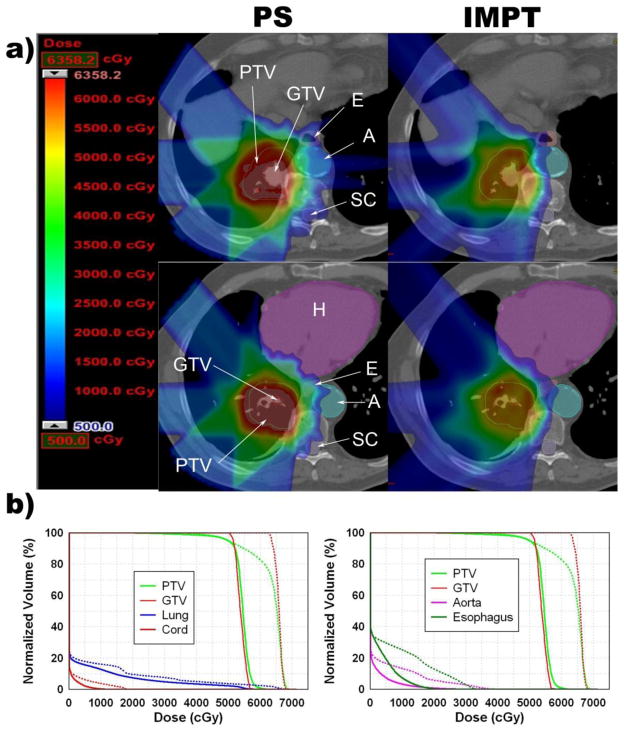
Purpose: To minimize toxicity while maintaining tumor coverage with stereotactic body radiation therapy (SBRT) for centrally or superiorly located stage I non-small-cell lung cancer (NSCLC), we investigated passive-scattering proton therapy (PSPT) and intensity-modulated proton therapy (IMPT).

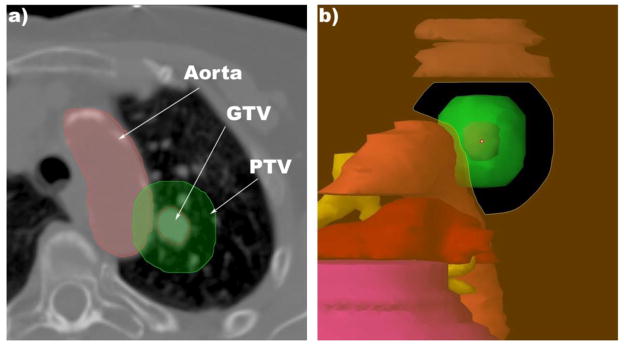
Methods and materials: Fifteen patients with centrally or superiorly located (within 2 cm of critical structures) stage I NSCLC were treated clinically with three-dimensional photon SBRT (50 Gy in 4 fractions). The photon SBRT plan was compared with the PSPT and IMPT plans. The maximum tolerated dose (MTD) was defined as the dose that exceeded the dose--volume constraints in the critical structures.

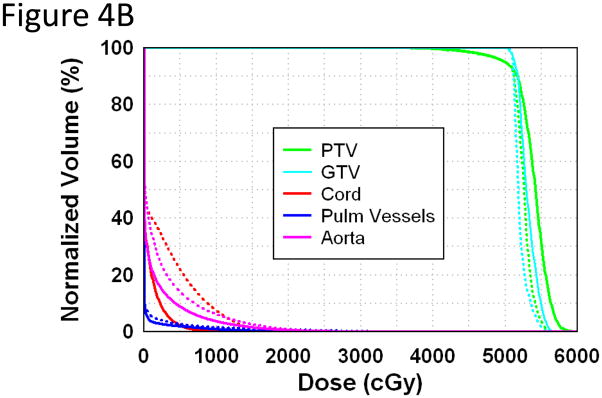
Results: Only 6 photon plans satisfied the >95% planning target volume (PTV) coverage and MTD constraints, compared to 12 PSPT plans (p = 0.009) and 14 IMPT plans (p = 0.001). Compared with the photon SBRT plans, the PSPT and IMPT plans significantly reduced the mean total lung dose from 5.4 Gy to 3.5 Gy (p < 0.001) and 2.8 Gy (p < 0.001) and reduced the total lung volume receiving 5 Gy, 10 Gy, and 20 Gy (p < 0.001). When the PTV was within 2 cm of the critical structures, the PSPT and IMPT plans significantly reduced the mean maximal dose to the aorta, brachial plexus, heart, pulmonary vessels, and spinal cord.

Conclusions: For centrally or superiorly located stage I NSCLC, proton therapy, particularly IMPT, delivered ablative doses to the target volume and significantly reduced doses to the surrounding normal tissues compared with photon SBRT.


Conflict of interest statement

Conflict of Interest Notification: Actual or potential conflicts of interest do not exist.

Figures

Figure 1
Figure 1
Comparison of PSPT, IMPT and photon SBRT for tumors near critical structures. A. PSPT (PS) or clinical photon (Clinical) SBRT for lesion near the bronchial tree and heart. B. IMPT or clinical photon (Clinical) SBRT for lesion near the bronchial tree, aorta, esophagus, and heart. (a) Color wash dose distributions shown with corresponding scale; maximum determined by plan with lower PTVmax. In the IMPT images, the gray zone seen inside the PTV represents where the IMPT plan had a dose higher than the scale maximum. Abbreviations: BT = bronchial tree; E = esophagus; SC = spinal cord; A = aorta; H = heart; PV = pulmonary vessel; PTV = plan target volume; GTV = gross target volume. (b) Dose-volume histograms. Dotted lines = PSPT or IMPT plan; solid lines = photon SBRT plan.
Figure 1
Figure 1
Comparison of PSPT, IMPT and photon SBRT for tumors near critical structures. A. PSPT (PS) or clinical photon (Clinical) SBRT for lesion near the bronchial tree and heart. B. IMPT or clinical photon (Clinical) SBRT for lesion near the bronchial tree, aorta, esophagus, and heart. (a) Color wash dose distributions shown with corresponding scale; maximum determined by plan with lower PTVmax. In the IMPT images, the gray zone seen inside the PTV represents where the IMPT plan had a dose higher than the scale maximum. Abbreviations: BT = bronchial tree; E = esophagus; SC = spinal cord; A = aorta; H = heart; PV = pulmonary vessel; PTV = plan target volume; GTV = gross target volume. (b) Dose-volume histograms. Dotted lines = PSPT or IMPT plan; solid lines = photon SBRT plan.
Figure 2
Figure 2
Improvement of IMPT compared with PSPT SBRT for a tumor close to the bronchial tree, esophagus, heart, spinal cord and aorta. (a) Color wash dose distributions shown with corresponding scale; maximum determined by plan with lower PTVmax. In the IMPT images, the gray zone seen inside the PTV represents where the IMPT plan had a dose higher than the scale maximum. (b) Dose-volume histograms. Dotted lines = PSPT plan; solid lines = IMPT SBRT plan.
Figure 3
Figure 3
SBRT for a lesion attached to aorta. (a) This axial cut shows the proximity of the GTV to the aorta and the degree of overlap between the aorta and the PTV. (b) Eye view of the beam for 1 of the fields for the PSPT plan.
Figure 4
Figure 4
A. Illustration showing the concept of using intensity modulation to reduce the penumbra. The thick green line denotes the target to be uniformly covered, and the solid red curve shows the dose profile calculated using the spots denoted by the single blue circles. The green target was not adequately covered owing to inadequate penumbra margin. Two options were used to cover the target: (1) increase the number of spots at the edge, denoted by dashed blue circles (large penumbra margin), and (2) increase the intensity of the spots at the edge, denoted by the double circles (small penumbra margin). The red-dashed curve shows the dose profile that adequately covered the target using those 2 approaches. B. Application of the 2 approaches on patients who received proton SBRT. Dose volume histogram of a plan using a 1-cm lateral/penumbra margin (dashed line) and 0.2-cm lateral/penumbra margin (solid line).
Figure 4
Figure 4
A. Illustration showing the concept of using intensity modulation to reduce the penumbra. The thick green line denotes the target to be uniformly covered, and the solid red curve shows the dose profile calculated using the spots denoted by the single blue circles. The green target was not adequately covered owing to inadequate penumbra margin. Two options were used to cover the target: (1) increase the number of spots at the edge, denoted by dashed blue circles (large penumbra margin), and (2) increase the intensity of the spots at the edge, denoted by the double circles (small penumbra margin). The red-dashed curve shows the dose profile that adequately covered the target using those 2 approaches. B. Application of the 2 approaches on patients who received proton SBRT. Dose volume histogram of a plan using a 1-cm lateral/penumbra margin (dashed line) and 0.2-cm lateral/penumbra margin (solid line).
Figure 5
Figure 5
(a) and (b) Illustrations of the concept of using a range shifter (RS) to reduce the spots size: dose distributions of a single spot with energy 138.1 MeV (a) and 171.3 MeV (b). Both spots reached the same depth in the body but with different lateral profiles at the depth of the arrows (red for the lower energy spot without RS, blue for the higher energy beam with RS). (c). The higher energy spots going through the RS demonstrated a smaller full width half maximum compared with the lower energy spot without RS in the body, indicating possible penumbra margin reduction.

Comment in

References

    1. Onishi H, Shirato H, Nagata Y, et al. Hypofractionated stereotactic radiotherapy (HypoFXSRT) for stage I non-small cell lung cancer: updated results of 257 patients in a Japanese multi-institutional study. J Thorac Oncol. 2007;2:S94–100. - PubMed
    1. Timmerman R, McGarry R, Yiannoutsos C, et al. Excessive toxicity when treating central tumors in a phase II study of stereotactic body radiation therapy for medically inoperable early-stage lung cancer. J Clin Oncol. 2006;24:4833–4839. - PubMed
    1. Chang JY, Balter PA, Dong L, et al. Stereotactic body radiation therapy in centrally and superiorly located stage I or isolated recurrent non-small-cell lung cancer. Int J Radiat Oncol Biol Phys. 2008;72:967–971. - PMC - PubMed
    1. Kelly P, Balter PA, Rebueno N, et al. Stereotactic body radiation therapy for patients with lung cancer previously treated with thoracic radiation. Int J Radiat Oncol Biol Phys. (In Press) - PMC - PubMed
    1. Chang JY, Zhang X, Wang X, et al. Significant reduction of normal tissue dose by proton radiotherapy compared with three-dimensional conformal or intensity-modulated radiation therapy in Stage I or Stage III non-small-cell lung cancer. Int J Radiat Oncol Biol Phys. 2006;65:1087–1096. - PubMed

Publication types

MeSH terms