

Tissue-specific transcript annotation and expression profiling with complementary next-generation sequencing technologies
- PMID: 20615900
- PMCID: PMC2938216
- DOI: 10.1093/nar/gkq602
Tissue-specific transcript annotation and expression profiling with complementary next-generation sequencing technologies
Abstract
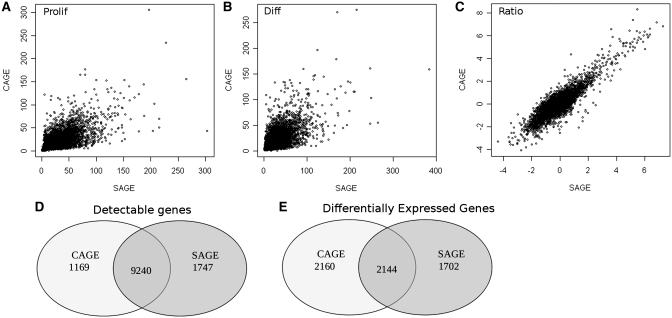
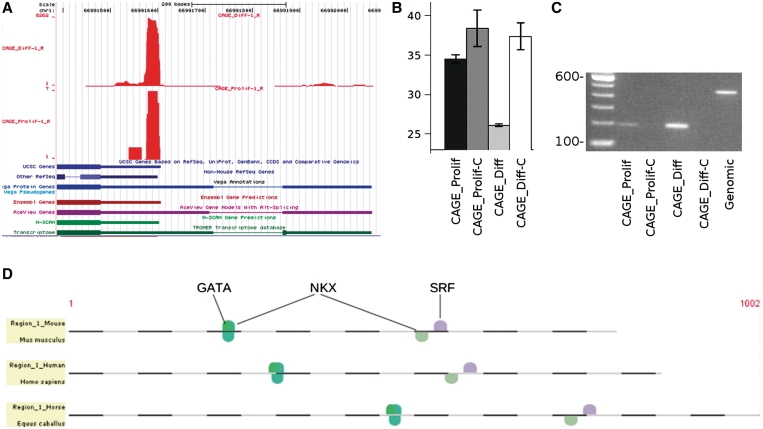
Next-generation sequencing is excellently suited to evaluate the abundance of mRNAs to study gene expression. Here we compare two alternative technologies, cap analysis of gene expression (CAGE) and serial analysis of gene expression (SAGE), for the same RNA samples. Along with quantifying gene expression levels, CAGE can be used to identify tissue-specific transcription start sites, while SAGE monitors 3'-end usage. We used both methods to get more insight into the transcriptional control of myogenesis, studying differential gene expression in differentiated and proliferating C2C12 myoblast cells with statistical evaluation of reproducibility and differential gene expression. Both CAGE and SAGE provided highly reproducible data (Pearson's correlations >0.92 among biological triplicates). With both methods we found around 10,000 genes expressed at levels >2 transcripts per million (approximately 0.3 copies per cell), with an overlap of 86%. We identified 4304 and 3846 genes differentially expressed between proliferating and differentiated C2C12 cells by CAGE and SAGE, respectively, with an overlap of 2144. We identified 196 novel regulatory regions with preferential use in proliferating or differentiated cells. Next-generation sequencing of CAGE and SAGE libraries provides consistent expression levels and can enrich current genome annotations with tissue-specific promoters and alternative 3'-UTR usage.
Figures
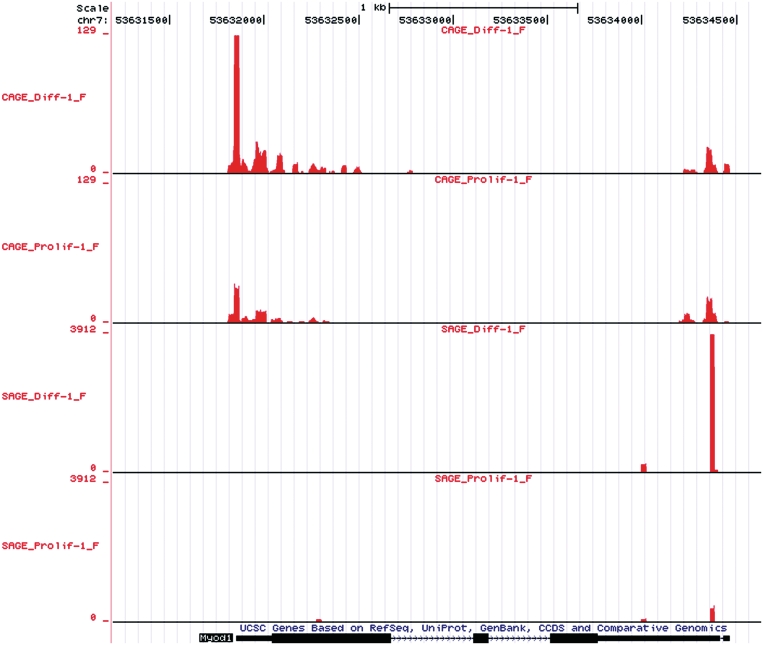
 and 3
and 3 concordance for CAGE and SAGE samples, respectively. CAGE provides broader peaks, reflecting TSSs plus
  26 nt of downstream sequence, wheres SAGE provides discrete peaks. A higher number of tags are in differentiated compared to proliferating samples.
References
-
- Velculescu VE, Zhang L, Vogelstein B, Kinzler KW. Serial analysis of gene expression. Science. 1995;270:484–487. - PubMed
-
- Harbers M, Carninci P. Tag-based approaches for transcriptome research and genome annotation. Nat. Methods. 2005;2:495–502. - PubMed
-
- Shiraki T, Kondo S, Katayama S, Waki K, Kasukawa T, Kawaji H, Kodzius R, Watahiki A, Nakamura M, Arakawa T. Cap analysis gene expression for high-throughput analysis of transcriptional starting point and identification of promoter usage. Proc. Natl Acad. Sci. USA. 2003;100:15776–15781. - PMC - PubMed
Publication types
MeSH terms
Substances
LinkOut - more resources
Full Text Sources
Molecular Biology Databases
Miscellaneous
