. 2010 Jul 20;107(29):13129-34.
doi: 10.1073/pnas.1002285107. Epub 2010 Jul 6.

Tbr1 regulates regional and laminar identity of postmitotic neurons in developing neocortex

Affiliations

Tbr1 regulates regional and laminar identity of postmitotic neurons in developing neocortex

Francesco Bedogni et al. Proc Natl Acad Sci U S A. .

Abstract

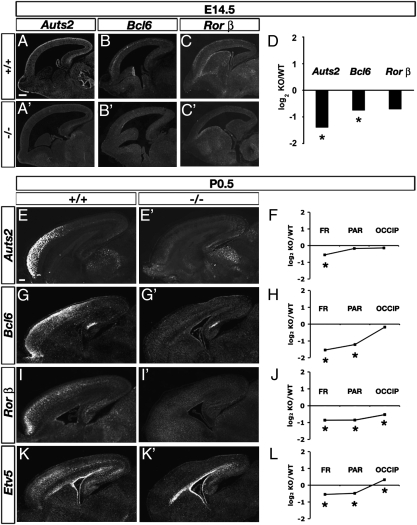
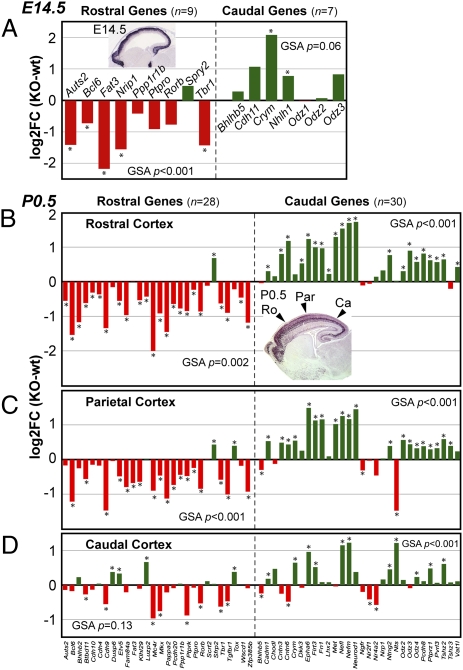
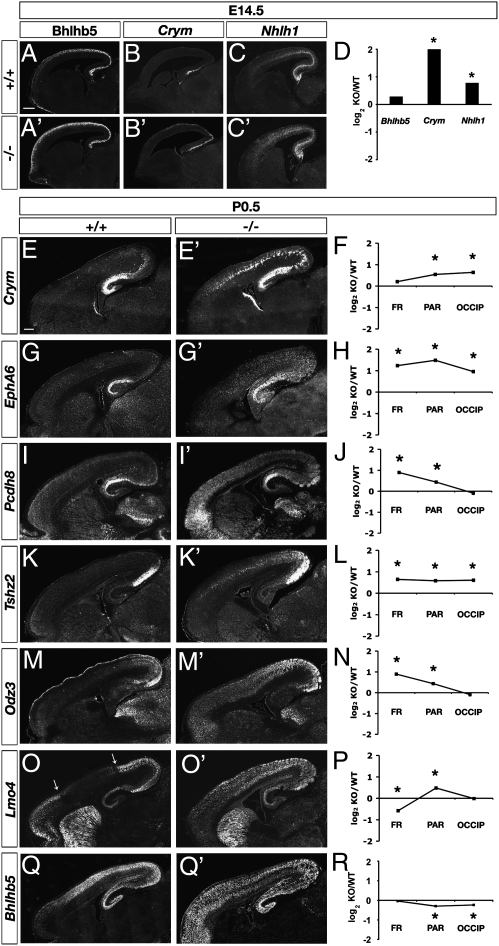
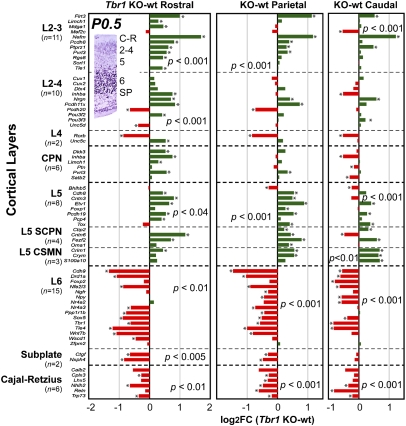
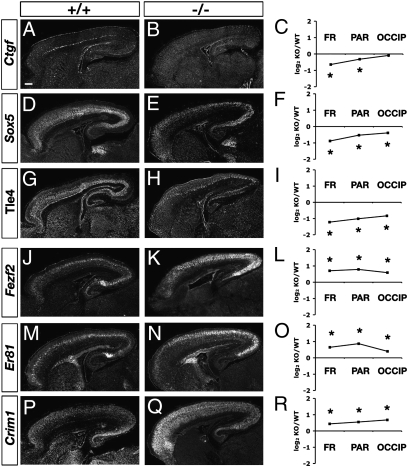
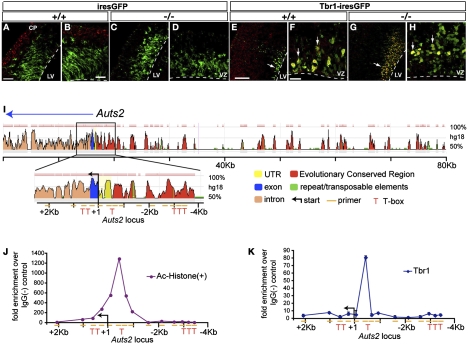
Areas and layers of the cerebral cortex are specified by genetic programs that are initiated in progenitor cells and then, implemented in postmitotic neurons. Here, we report that Tbr1, a transcription factor expressed in postmitotic projection neurons, exerts positive and negative control over both regional (areal) and laminar identity. Tbr1 null mice exhibited profound defects of frontal cortex and layer 6 differentiation, as indicated by down-regulation of gene-expression markers such as Bcl6 and Cdh9. Conversely, genes that implement caudal cortex and layer 5 identity, such as Bhlhb5 and Fezf2, were up-regulated in Tbr1 mutants. Tbr1 implements frontal identity in part by direct promoter binding and activation of Auts2, a frontal cortex gene implicated in autism. Tbr1 regulates laminar identity in part by downstream activation or maintenance of Sox5, an important transcription factor controlling neuronal migration and corticofugal axon projections. Similar to Sox5 mutants, Tbr1 mutants exhibit ectopic axon projections to the hypothalamus and cerebral peduncle. Together, our findings show that Tbr1 coordinately regulates regional and laminar identity of postmitotic cortical neurons.


Conflict of interest statement

The authors declare no conflict of interest.

Figures

Fig. 1.
Fig. 1.
Down-regulation of rostral marker genes in Tbr1 mutant cortex. (AD) E14.5. Auts2 (A and A′), Bcl6 (B and B′), and Rorb (C and C′) mRNA were reduced in Tbr1 null rostral cortex (A′–C′) compared with controls (AC). Microarray results (D) confirmed down-regulation of these genes, although only Auts2 and Bcl6 reached statistical significance. *P < 0.05. (EL) P0.5. Auts2 (E and E′), Bcl6 (G and G′), Rorb (I and I′), and Etv5 (K and K′) mRNA were reduced in Tbr1 null frontal cortex (E′, G′, I′, and K′) compared with controls (E, G, I, and K). Microarray profiling (F, H, J, and L) showed significant reductions of these genes mainly in frontal (FR) and parietal (PAR) regions of Tbr1 mutant cortex. Microarray results are expressed as log2 of the ratio between knockout (KO) and wild-type (WT) normalized mRNA levels. OCCIP, occipital cortex. [Scale bars (AK′): 200 μm.]
Fig. 2.
Fig. 2.
Microarray analysis of rostral and caudal marker genes in Tbr1 null cortex. (A) E14.5. Most rostral markers decreased (red) and caudal markers increased (green) in Tbr1 null cortex. GSA P values indicate the probability that sets of genes (rostral or caudal) increased or decreased by chance. (Inset) Tbr1 ISH, E14.5 (28). (BD) P0.5. Rostral and caudal markers were analyzed in rostral (B), parietal (C), and caudal (D) regions of Tbr1 KO cortex versus controls. (B Inset) Tbr1 immunohistochemistry, E18.5. n, number of genes in the set.
Fig. 3.
Fig. 3.
Up-regulation of caudal marker genes in Tbr1 mutant cortex. (AD) E14.5. Immunofluorescence for Bhlhb5 (A and A′) and ISH for Crym (B and B′) and Nhlh1 (C and C′) showed increased rostral expression of these genes in Tbr1 null cortex (A′–C′) compared with controls (AC). (D) Microarray results showed that Crym and Nhlh1 expression changes were statistically significant. (ER) P0.5. Crym (E and E′), Epha6 (G and G′), Pcdh8 (I and I′), Tshz2 (K and K′), Odz3 (M and M′), Lmo4 (O and O′), and Bhlhb5 (Q and Q′) mRNA were increased in Tbr1 null cortex. The Lmo4 low-expression domain (O, between arrows) was shifted rostrally in Tbr1 null cortex (O′). Bhlhb5 expression was disorganized and increased rostrally in the malformed Tbr1 null cortex (Q′) compared with control (Q). Microarray results are shown in F, H, J, L, N, P, and R. [Scale bars (AQ′): 200 μm.]
Fig. 4.
Fig. 4.
Microarray profiling of laminar marker genes in P0.5 Tbr1 mutant mice. Layer 6, SP, and C-R cell markers were down-regulated in all regions of Tbr1 null cortex. Layer 5 markers were up-regulated in all regions, including markers of subcerebral projection neurons (SCPNs) and corticospinal motor neurons (CSMNs). Markers of layers 2 and 3 were also mostly up-regulated in Tbr1 null cortex. Callosal projection neurons (CPN) were not significantly elevated overall, as determined by GSA. (Inset) Tbr1 immunohistochemistry (P0.5) showing laminar expression in parietal cortex.
Fig. 5.
Fig. 5.
Expression of subplate, layer 6, and layer 5 marker genes in Tbr1 null cortex. (AI) SP and layer 6 markers Ctgf (AC), Sox5 (DF), and Tle4 (GI) had decreased expression in Tbr1 null cortex by ISH and microarray. (JR) Layer 5 markers Fezf2 (JL), Er81 (MO), and Crim1 (PR) had increased expression. [Scale bars (AQ): 200 μm.]
Fig. 6.
Fig. 6.
Tbr1 binds and activates the Auts2 gene in neocortex in vivo. (AH) Tbr1 expression plasmid (Tbr1–ires GFP), but not GFP only (ires–GFP), drove ectopic expression of Auts2 (red) in electroporated GFP+ cells (green) in control (A, B, E, and F) and Tbr1 null (C, D, G, and H) VZ. The electroporated region from A, C, E, and G is shown at higher magnification in B, D, F, and H. [Scale bars (A and C): 50; (B and D): 30 μm; (E and G): 100 μm; (F and H): 25 μm.] (I) Sequence analysis of the Auts2 promoter and proximal coding region identified six candidate Tbr1 binding sites (red T). (J) ChIP of acetylated histones from E14.5 forebrain showed that the Auts2 transcriptional start site was highly enriched in open chromatin. (K) Tbr1 ChIP showed Tbr1 binding to a candidate site in the region of open chromatin (J) adjacent to the Auts2 transcriptional start site.

References

    1. Rakic P, Ayoub AE, Breunig JJ, Dominguez MH. Decision by division: Making cortical maps. Trends Neurosci. 2009;32:291–301. - PMC - PubMed
    1. Molyneaux BJ, Arlotta P, Menezes JR, Macklis JD. Neuronal subtype specification in the cerebral cortex. Nat Rev Neurosci. 2007;8:427–437. - PubMed
    1. O'Leary DD, Sahara S. Genetic regulation of arealization of the neocortex. Curr Opin Neurobiol. 2008;18:90–100. - PMC - PubMed
    1. Leone DP, Srinivasan K, Chen B, Alcamo E, McConnell SK. The determination of projection neuron identity in the developing cerebral cortex. Curr Opin Neurobiol. 2008;18:28–35. - PMC - PubMed
    1. Rash BG, Grove EA. Area and layer patterning in the developing cerebral cortex. Curr Opin Neurobiol. 2006;16:25–34. - PubMed

Publication types

MeSH terms

Associated data