

Individual histories and selection in heterogeneous populations
- PMID: 20616073
- PMCID: PMC2919897
- DOI: 10.1073/pnas.0912538107
Individual histories and selection in heterogeneous populations
Abstract
The strength of selection in populations has traditionally been inferred by measuring changes in bulk population parameters, such as mean reproductive rates. Untangling the effect of selection from other factors, such as specific responses to environmental fluctuations, poses a significant problem both in microbiology and in other fields, including cancer biology and immunology, where selection occurs within phenotypically heterogeneous populations of cells. Using "individual histories"--temporal sequences of all reproduction events and phenotypic changes of individuals and their ancestors--we present an alternative approach to quantifying selection in diverse experimental settings. Selection is viewed as a process that acts on histories, and a measure of selection that employs the distribution of histories is introduced. We apply this measure to phenotypically structured populations in fluctuating environments across different evolutionary regimes. Additionally, we show that reproduction events alone, recorded in the population's tree of cell divisions, may be sufficient to accurately measure selection. The measure is thus applicable in a wide range of biological systems, from microorganisms--including species for which genetic tools do not yet exist--to cellular populations, such as tumors and stem cells, where detailed temporal data are becoming available.
Conflict of interest statement
The authors declare no conflict of interest.
Figures
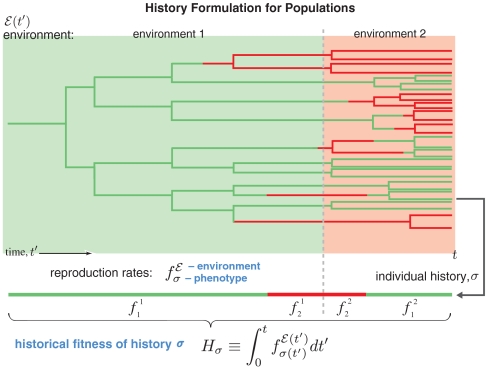
 is indicated by the background color. In each type of environment (green or red), the adapted phenotype, i.e., the fastest reproducing one, matches the environment’s color.
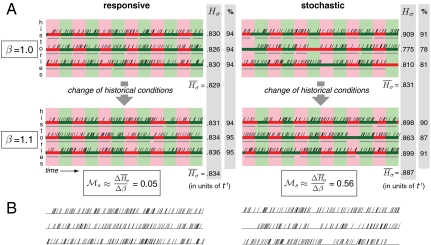
 is the same (
 ); simulation results reflect this, with slight deviations due to the small number and short length of histories shown. Direct estimates of
  are in good agreement with analytically computed values
  (responsive) and
  (stochastic). (B) Histories in normal historical conditions from A are shown with historical divisions only (phenotypic states and environments are not displayed). Selection here is stronger for slow stochastic switching, seen via its high value of
  and non-Poissonian (patchy) distribution of historical divisions.
 on the environmental duration τ for the two-state models of stochastic and responsive switching described in the text. Fitness values for all models shown are fa = 1 and fna = 0.1. The dashed line in all panels is the curve 1/τ, shown for reference. All rates, including fa, fna, s, sr, and
  , are given in arbitrary units of 1/time, with τ shown in the same units of time. (A and B) Analytically computed curves are shown for pure stochastic switching (A), for given values of s, and for responsive switching (B), for given values of sr with s = 0.1. (C) Measurements of
  (filled circles) using statistics of cell divisions from stochastic population simulations are compared with analytically computed values (solid curve). Blue: pure stochastic switching with s = 0.01; magenta: responsive switching, with sr = 0.95 and s = 0.05. Each point is an average over 100 estimates of
  that were generated (see Methods); the bars on three representative points show the standard deviation of the estimates. The blue curves in A and C are identical.
Comment in
-
Systems biology: Learning from history.Nat Methods. 2010 Sep;7(9):672-3. doi: 10.1038/nmeth0910-672b. Nat Methods. 2010. PMID: 20827802
References
-
- Elena S, Lenski R. Evolution experiments with microorganisms: The dynamics and genetic bases of adaptation. Nat Rev Genet. 2003;4:457–469. - PubMed
-
- Balaban N, Gefen O. The importance of being persistent: Heterogeneity of bacterial populations under antibiotic stress. FEMS Microbiol Rev. 2009;33:704–17. - PubMed
-
- Suel G, Garcia-Ojalvo J, Liberman L, Elowitz M. An excitable gene regulatory circuit induces transient cellular differentiation. Nature. 2006;440:545–550. - PubMed
-
- Moxon R, Bayliss C, Hood D. Bacterial contingency loci: The role of simple sequence DNA repeats in bacterial adaptation. Annu Rev Genet. 2006;40:307–333. - PubMed
Publication types
MeSH terms
LinkOut - more resources
Full Text Sources
Molecular Biology Databases
