

doi: 10.1073/pnas.1007092107.
Epub 2010 Jul 1.
Identification of a cellulose synthase-associated protein required for cellulose biosynthesis
Affiliations
- PMID: 20616083
- PMCID: PMC2919928
- DOI: 10.1073/pnas.1007092107
Item in Clipboard
Identification of a cellulose synthase-associated protein required for cellulose biosynthesis
Proc Natl Acad Sci U S A.
.
Abstract
Cellulose synthase-interactive protein 1 (CSI1) was identified in a two-hybrid screen for proteins that interact with cellulose synthase (CESA) isoforms involved in primary plant cell wall synthesis. CSI1 encodes a 2,150-amino acid protein that contains 10 predicted Armadillo repeats and a C2 domain. Mutations in CSI1 cause defective cell elongation in hypocotyls and roots and reduce cellulose content. CSI1 is associated with CESA complexes, and csi1 mutants affect the distribution and movement of CESA complexes in the plasma membrane.
Conflict of interest statement
The authors declare no conflict of interest.
Figures
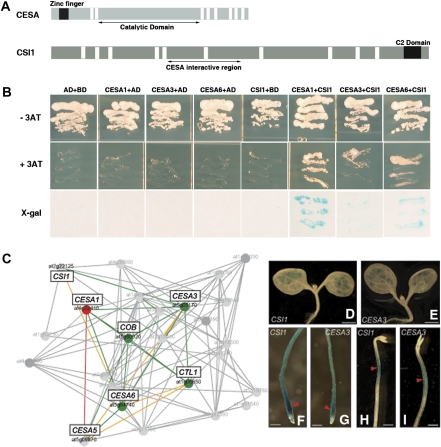
Identification of CSI1. (A) Schematic representation of CESA and CSI1 proteins. White bars represent predicted transmembrane domains and ARM repeats in CESA and CSI1, respectively. The regions of the proteins used for the two-hybrid interaction tests are shown as arrows below the bars representing the proteins. (B) CSI1 interacts with three primary CESA proteins in yeast. CSI1 fused with GAL4-AD specifically interacted with the central catalytic domain of three primary CESAs fused with GAL4-BD. (C) Truncated coexpression network for primary wall cellulose-related genes using the AraGenNet at http://aranet.mpimp-golm.mpg.de/aranet/AraGenNet (29). Colored lines indicate strength of transcriptional coordination: green, mutual rank ≤10; orange, mutual rank ≤20; red, mutual rank ≤30. Connections of moderate interest for the study are shown in gray. Low mutual rank indicates stronger coexpression relationships. (D–I) Promoter GUS analysis of CSI1::GUS (D, F, and H) and CESA3::GUS (E, G, and I). GUS staining pattern is shown in light-grown seedlings (D and E) and etiolated seedlings (F–I). Red arrows indicate strong GUS activity. (Scale bars: 750 μm in D and E and 200 μm in F–I.)
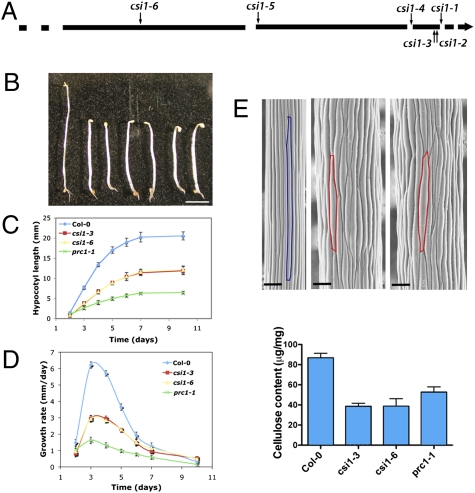
CSI1 is required for normal cell expansion. (A) Schematic representation of six T-DNA insertion sites in csi1. Exons are represented by black lines, and introns are shown by breaks. (B) Morphology of 4-d-old dark-grown seedlings: (Left to Right) Col-0 (wild-type) and csi1-1, csi1-2, csi1-3, csi1-4, csi1-5, and csi1-6 mutants. (Scale bar: 2 mm.) (C and D) Hypocotyl length (C) and growth rate (D) of dark-grown wild-type (Col-0) plants and csi1-3, csi1-6, and prc1-1 mutants. Data were collected from the measurement of ~50 seedlings for each genotype. Error bars represent SE (absent error bars were obscured by symbols). (E) SEM of dark-grown hypocotyls in wild-type plants and csi1 mutants: (Left to Right) Arabidopsis thaliana Columbia (Col-0), csi1-3, and csi1-6 mutants. Colors outline one epidermal cell. (Scale bar: 100 μM.) (F) Cellulose content was reduced in csi1 mutants. n = 5. Error bars represent SE.
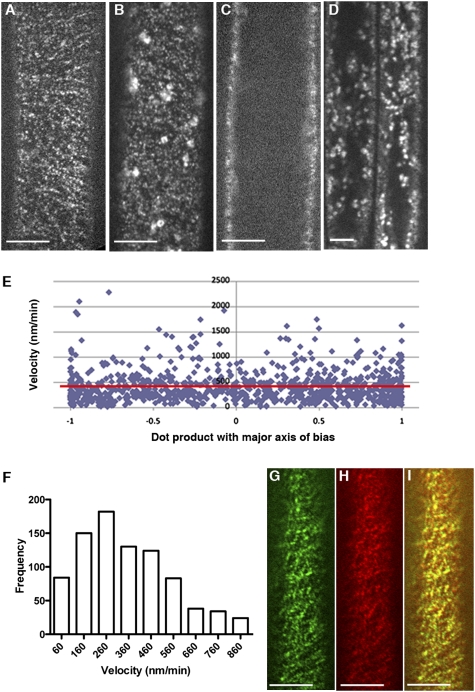
CSI1 is localized to CESA-like particles in dark-grown hypocotyls cells. (A–D) Optical sections of epidermal cells in 3-d-old dark-grown hypocotyls expressing RFP-CSI1 (A and C) and YFP-CESA6 (B and D). Focal planes of the plasma membrane (A and B) and lower cortex (C and D) are shown. (Scale bar: 5 μm.) (E) Plot of RFP-CSI1 particle velocity vs. its dot product (i.e., scalar product; see Methods) with the direction of bias. Red line indicates the linear regression of the plot. A slope of 0 indicates no bias in direction. (F) Histogram of measured RFP-CSI1 particle velocities. The mean is 416 nm/min (n = 917). (G–I) Localization of GFP-CESA3 (G), RFP-CSI1 (H), and merge (I). (Scale bar: 5 μm.)
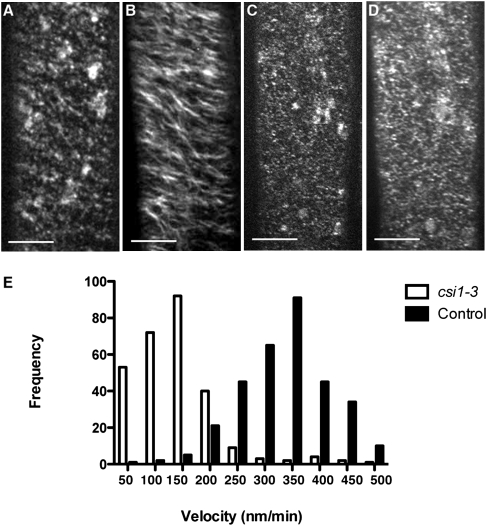
YFP-CESA6 dynamics are altered in csi1-3 mutants. YFP-CESA6 localization in dark-grown hypocotyls cells is shown in wild-type plants (A and B) and csi1-3 mutants (C and D). (A) A single optical section acquired at the plane of plasma membrane in wild-type plants. (B) Average of 61 frames (duration: 2 min; 2-s interval) showing movement of labeled particles along linear trajectories. (C) Single optical section of YFP-CESA6 in csi1-3 mutant. (D) Average of 61 frames (duration: 2 min; 2-s interval) in csi1-3 mutant. (Scale bars: 5 μm.) (E) Histogram of measured particle velocities. The mean velocity is 365 nm/min in control plants (n = 318) and 132 nm/min in csi1-3 mutants (n = 225).
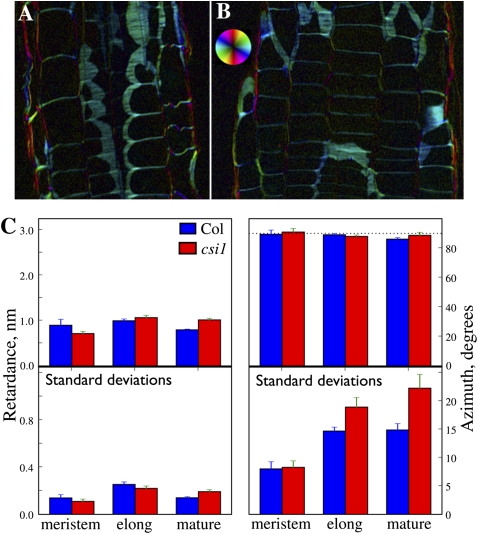
Polarized light analysis of csi1 mutants. (A and B) Polarized-light micrographs of (A) wild-type and (B) csi1-1-mutant roots. Images are of longitudinal-tangential sections through cortex and epidermis. Intensity is proportional to retardance, and color represents optical axis (azimuth) of the crystalline elements, as shown by the color wheel. Note the similar intensity and color for the two genotypes. (C) Quantification of retardance and azimuth (90° is transverse to the root's long axis). Top panels show means ± SEM (n = 3 roots); bottom panels show the average SD (n ~ 200 measurements) ± SEM for each of the roots. Note the larger SDs for csi1-1 mutants in the elongation and mature zones.
References
Publication types
MeSH terms
Substances
LinkOut - more resources
Full Text Sources
Other Literature Sources
Molecular Biology Databases
Research Materials
Miscellaneous
