. 2010 Jul 6;107(27):12381-6.
doi: 10.1073/pnas.1006061107. Epub 2010 Jun 28.

HIV, transmitted drug resistance, and the paradox of preexposure prophylaxis

Affiliations

HIV, transmitted drug resistance, and the paradox of preexposure prophylaxis

Virginie Supervie et al. Proc Natl Acad Sci U S A. .

Abstract

The administration of antiretrovirals before HIV exposure to prevent infection (i.e., preexposure prophylaxis; PrEP) is under evaluation in clinical trials. Because PrEP is based on antiretrovirals, there is considerable concern that it could substantially increase transmitted resistance, particularly in resource-rich countries. Here we use a mathematical model to predict the effect of PrEP interventions on the HIV epidemic in the men-who-have-sex-with-men community in San Francisco. The model is calibrated using Monte Carlo filtering and analyzed by constructing nonlinear response hypersurfaces. We predict PrEP interventions could substantially reduce transmission but significantly increase the proportion of new infections caused by resistant strains. Two mechanisms can cause this increase. If risk compensation occurs, the proportion increases due to increasing transmission of resistant strains and decreasing transmission of wild-type strains. If risk behavior remains stable, the increase occurs because of reduced transmission of resistant strains coupled with an even greater reduction in transmission of wild-type strains. We define this as the paradox of PrEP (i.e., resistance appears to be increasing, but is actually decreasing). We determine this paradox is likely to occur if the efficacy of PrEP regimens against wild-type strains is greater than 30% and the relative efficacy against resistant strains is greater than 0.2 but less than the efficacy against wild-type. Our modeling shows, if risk behavior increases, that it is a valid concern that PrEP could significantly increase transmitted resistance. However, if risk behavior remains stable, we find the concern is unfounded and PrEP interventions are likely to decrease transmitted resistance.


Conflict of interest statement

The authors declare no conflict of interest.

Figures

Fig. 1.
Fig. 1.
Simplified flow diagram of the PrEP intervention model. The model includes susceptible individuals, infected untreated individuals, and individuals on therapeutic treatment. Susceptible individuals can be infected with wild-type (dark blue arrows) or resistant (red arrows) strains. Individuals not taking PrEP are represented by dotted circles or squares, and individuals taking PrEP are represented by solid circles or squares. Infected individuals can acquire resistance (thick red arrow) if prescribed PrEP before their infection is detectable or if they become infected on PrEP and continue taking PrEP. The model also includes the effect of therapeutic treatment with antiretrovirals and the development of resistance during therapeutic treatment (orange arrow). Resistant strains can revert to wild-type strains when the selection pressure of drug treatment is removed (light blue arrow).
Fig. 2.
Fig. 2.
Simplified flow diagram representing disease progression, the window period of an HIV test, and testing frequency. The primary infection phase is split into two phases: (i) the phase where the infection is not detectable with HIV tests (phase A1) and (ii) the phase where the infection is detectable (phase A2). Susceptibles can go on and off PrEP. Infected individuals move through four stages of infection before treatment: phase A1, phase A2, not eligible for treatment (i.e., CD4 count > 350 cells/μL), and eligible for treatment (i.e., CD4 ≤ 350 cells/μL) but not on treatment. Infected individuals off PrEP (dotted circle) can inadvertently be prescribed PrEP (gray arrow) but only during a very short period after the infection has occurred (i.e., during phase A1). In contrast, infected individuals off PrEP (dotted circle) with detectable infection (i.e., in phase A2 or in not treatment-eligible phase) cannot be prescribed PrEP. Infected individuals who were inadvertently prescribed PrEP (solid circle) and individuals who were infected despite taking PrEP (solid square) can develop resistance (red arrow) as long as they are on PrEP. The testing frequency (or, equivalently, the length of the PrEP prescription) determines when infected individuals on PrEP will stop taking PrEP once the infection is detectable.
Fig. 3.
Fig. 3.
Nonlinear response surfaces, including interaction terms, were constructed from data generated by the PrEP intervention model. (A) Response surface of the percentage of cumulative infections prevented over 10 y after introducing PrEP assuming no increase in risk behavior as a function of the coverage of PrEP (SRC = 0.45, 95% CI = 0.42;0.47) versus the efficacy of PrEP against wild-type strains (SRC = 0.76, 95% CI = 0.74;0.78). (B) Response surface of the percentage of cumulative infections prevented over 10 y after introducing PrEP assuming risk compensation occurs as a function of the increase in the number of new sex partners per y (SRC = −0.47, 95% CI = −0.50;−0.45) versus decrease in the use of condoms (SRC = −0.19, 95% CI = −0.21;−0.17). The black line delimits the threshold at which a PrEP intervention has no effect on reducing transmission; above the line transmission increases, and below the line transmission decreases. (C) Response surface of the proportion of new infections due to resistant viruses 10 y after introducing PrEP assuming no increase in risk behavior as a function of the coverage of PrEP (SRC = 0.33, 95% CI = 0.31;0.35) versus the efficacy of PrEP against wild-type strains (SRC = 0.47, 95% CI = 0.45;0.49).
Fig. 4.
Fig. 4.
Relationship between the proportion of new infections that are due to resistant viruses 10 y after introducing PrEP and the ANI ratio for resistant strains (A) assuming risk compensation occurs and (B) assuming no increase in risk behavior. DR, drug-resistant; TDR, transmitted drug resistance.
Fig. 5.
Fig. 5.
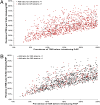
Results from the PrEP intervention model. Scatterplots of the ANI ratio for resistant strains versus the ANI ratio for wild-type strains 10 y after introducing PrEP (A) assuming risk compensation occurs and (B) assuming no increase in risk behavior; dots are color-coded according to the values of the ANI ratios: blue if both ratios < 1; green if both ratios > 1; and black if the ANI ratio for resistant strains > 1 and the ANI ratio for wild-type strains < 1. (C) Response surface of the ANI ratio for resistant strains 10 y after introducing PrEP assuming no increase in risk behavior as a function of the efficacy of PrEP against wild-type strains (SRC = −0.30, 95% CI = −0.32;−0.28) versus the relative efficacy of PrEP (SRC = −0.81, 95% CI = −0.86;−0.83). The black line delimits the threshold at which a PrEP intervention would have no effect on reducing the number of resistant infections; to the right of the line the number of resistant infections decreases, and to the left of the line the number increases. (D) Response surface of the ANI ratio for resistant strains 10 y after introducing PrEP assuming risk compensation occurs as a function of the increase in the number of new sex partners per y (SRC = 0.62, 95% CI = 0.59;0.64) versus the percentage decrease in the use of condoms (SRC = 0.24, 95% CI = 0.21;0.27). The black line delimits the threshold at which a PrEP intervention would have no effect on increasing the number of resistant infections; below the line the number decreases, and above the line the number increases.

Similar articles

Cited by

References

    1. Paxton LA, Hope T, Jaffe HW. Pre-exposure prophylaxis for HIV infection: What if it works? Lancet. 2007;370:89–93. - PubMed
    1. AVAC 2010. PrEP clinical trials. Available at http://www.avac.org/ht/d/sp/i/3507/pid/3507. Accessed April 30, 2010.
    1. Peterson L, et al. Tenofovir disoproxil fumarate for prevention of HIV infection in women: A phase 2, double-blind, randomized, placebo-controlled trial. PLoS Clin Trials. 2007;2:e27. - PMC - PubMed
    1. Abdool Karim SS, Baxter C. Antiretroviral prophylaxis for the prevention of HIV infection: Future implementation challenges. HIV Ther. 2009;3:3–6.
    1. Booth CL, Geretti AM. Prevalence and determinants of transmitted antiretroviral drug resistance in HIV-1 infection. J Antimicrob Chemother. 2007;59:1047–1056. - PubMed

Publication types

Substances