

Sucrose feeding reverses shade-induced kernel losses in maize
- PMID: 20616114
- PMCID: PMC2924829
- DOI: 10.1093/aob/mcq132
Sucrose feeding reverses shade-induced kernel losses in maize
Abstract
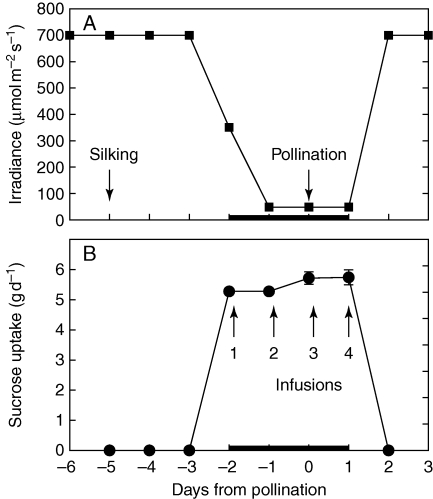
Background and aims: Water limitations can inhibit photosynthesis and change gene expression in ways that diminish or prevent reproductive development in plants. Sucrose fed to the plants can reverse the effects. To test whether the reversal acts generally by replacing the losses from photosynthesis, sucrose was fed to the stems of shaded maize plants (Zea mays) during reproductive development.
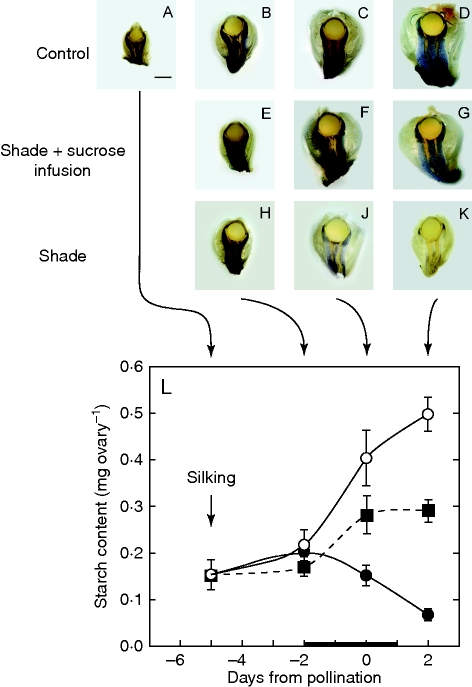
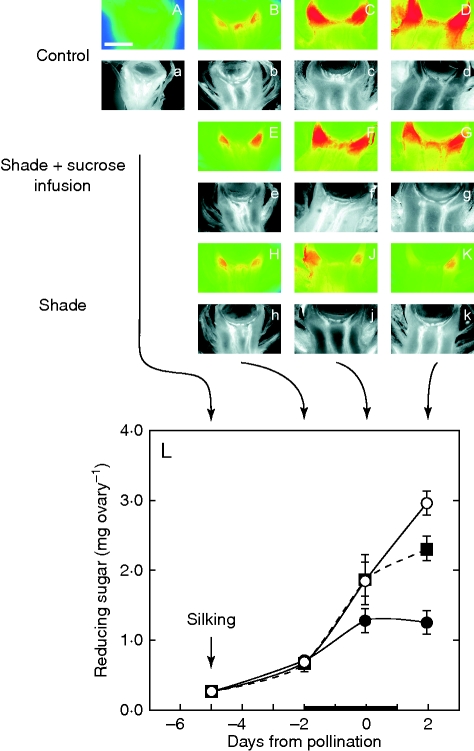
Methods: Shading was adjusted to mimic the inhibition of photosynthesis around the time of pollination in water-limited plants. Glucose and starch were imaged and quantified in the female florets. Sucrose was infused into the stems to vary the sugar flux to the ovaries.
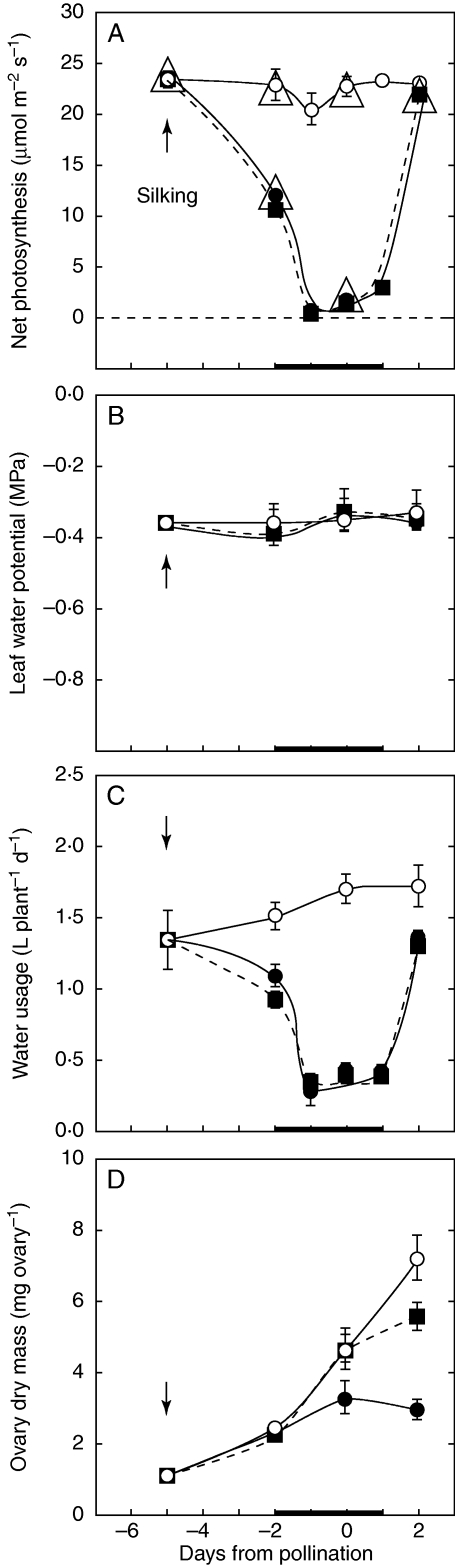
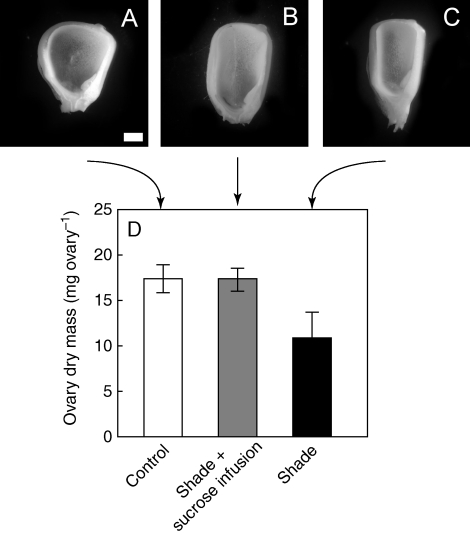
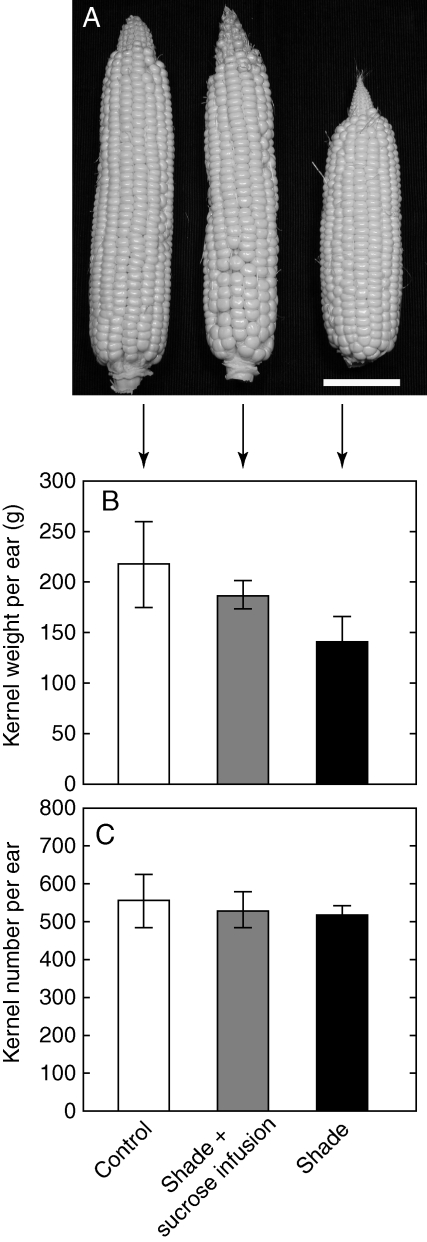
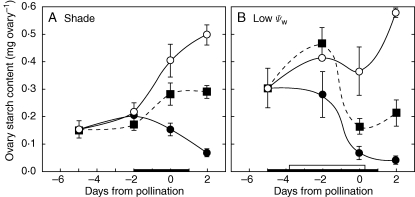
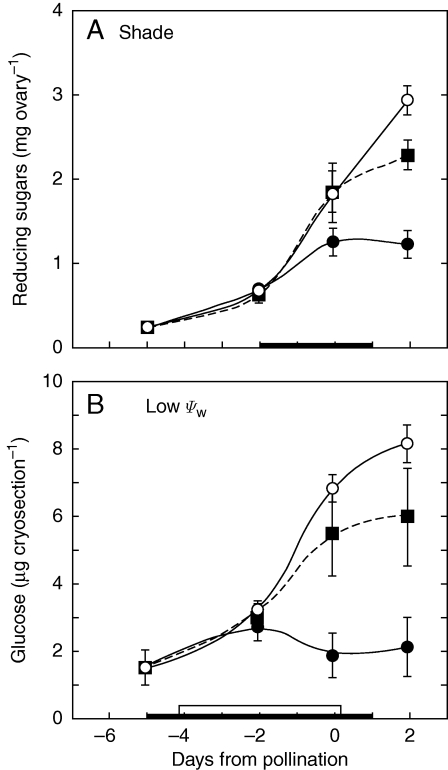
Key results: Ovaries normally grew rapidly and contained large amounts of glucose and starch, with a glucose gradient favouring glucose movement into the developing ovary. Shade inhibited photosynthesis and diminished ovary and kernel size, weight, and glucose and starch contents compared with controls. The glucose gradient became small. Sucrose fed to the stem reversed these losses, and kernels were as large as the controls.
Conclusions: Despite similar inhibition of photosynthesis, the depletion of ovary glucose and starch was not as severe in shade as during a comparable water deficit. Ovary abortion prevalent during water deficits did not occur in the shade. It is suggested that this difference may have been caused by more translocation in shade than during the water deficit, which prevented low sugar contents necessary to trigger an up-regulation of senescence genes known to be involved in abortion. Nevertheless, sucrose feeding reversed kernel size losses and it is concluded that feeding acted generally to replace diminished photosynthetic activity.
Figures
Similar articles
-
Glucose localization in maize ovaries when kernel number decreases at low water potential and sucrose is fed to the stems.Ann Bot. 2004 Jul;94(1):75-86. doi: 10.1093/aob/mch123. Epub 2004 May 24. Ann Bot. 2004. PMID: 15159218 Free PMC article.
-
Sugar-responsive gene expression, invertase activity, and senescence in aborting maize ovaries at low water potentials.Ann Bot. 2004 Nov;94(5):675-89. doi: 10.1093/aob/mch193. Epub 2004 Sep 8. Ann Bot. 2004. PMID: 15355866 Free PMC article.
-
Imaging and quantifying carbohydrate transport to the developing ovaries of maize.Ann Bot. 2005 Oct;96(5):939-49. doi: 10.1093/aob/mci246. Epub 2005 Aug 12. Ann Bot. 2005. PMID: 16100223 Free PMC article.
-
Grain yields with limited water.J Exp Bot. 2004 Nov;55(407):2385-94. doi: 10.1093/jxb/erh219. Epub 2004 Jul 30. J Exp Bot. 2004. PMID: 15286147 Review.
-
Reappraisal of the currently prevailing model of starch biosynthesis in photosynthetic tissues: a proposal involving the cytosolic production of ADP-glucose by sucrose synthase and occurrence of cyclic turnover of starch in the chloroplast.Plant Cell Physiol. 2001 Dec;42(12):1311-20. doi: 10.1093/pcp/pce175. Plant Cell Physiol. 2001. PMID: 11773523 Review.
Cited by
-
Combating Dual Challenges in Maize Under High Planting Density: Stem Lodging and Kernel Abortion.Front Plant Sci. 2021 Nov 2;12:699085. doi: 10.3389/fpls.2021.699085. eCollection 2021. Front Plant Sci. 2021. PMID: 34868101 Free PMC article. Review.
-
Characterization of the Effect of Increased Plant Density on Canopy Morphology and Stalk Lodging Risk.Front Plant Sci. 2018 Sep 11;9:1047. doi: 10.3389/fpls.2018.01047. eCollection 2018. Front Plant Sci. 2018. PMID: 30254649 Free PMC article.
-
Is Change in Ovary Carbon Status a Cause or a Consequence of Maize Ovary Abortion in Water Deficit during Flowering?Plant Physiol. 2016 Jun;171(2):997-1008. doi: 10.1104/pp.15.01130. Epub 2016 Apr 19. Plant Physiol. 2016. PMID: 27208256 Free PMC article.
-
Delayed pollination and low availability of assimilates are major factors causing maize kernel abortion.J Exp Bot. 2018 Mar 24;69(7):1599-1613. doi: 10.1093/jxb/ery013. J Exp Bot. 2018. PMID: 29365129 Free PMC article.
-
The role of Tre6P and SnRK1 in maize early kernel development and events leading to stress-induced kernel abortion.BMC Plant Biol. 2017 Apr 12;17(1):74. doi: 10.1186/s12870-017-1018-2. BMC Plant Biol. 2017. PMID: 28403831 Free PMC article.
References
-
- Andrade FH, Uhart SA, Frugone MI. Intercepted radiation at flowering and kernel number in maize: shade versus plant density effects. Crop Science. 1993;33:482–485.
-
- Boyer JS. Measuring the water status of plants and soils. San Diego, CA: Academic Press; 1995.
-
- Boyer JS, McLaughlin JE. Functional reversion to identify controlling genes in multigenic responses: analysis of floral abortion. Journal of Experimental Botany. 2007;58:267–277. - PubMed
