

Renal function equations before and after living kidney donation: a within-individual comparison of performance at different levels of renal function
- PMID: 20616162
- PMCID: PMC3001772
- DOI: 10.2215/CJN.08761209
Renal function equations before and after living kidney donation: a within-individual comparison of performance at different levels of renal function
Abstract
Background and objectives: The Modification of Diet in Renal Disease (MDRD) study equation and the Cockcroft-Gault (CG) equation perform poorly in the (near-) normal range of GFR. Whether this is due to the level of GFR as such or to differences in individual characteristics between healthy individuals and patient with chronic kidney disease (CKD) is unknown.
Design, setting, participants, & measurements: We evaluated the performance of MDRD, CG per BSA (CG/(BSA)) and Chronic Kidney Disease Epidemiology Collaboration (CKD-EPI) equations compared with measured GFR (mGFR; I-iothalamate) at 4 months before and 2 months after donation in 253 consecutive living kidney donors.
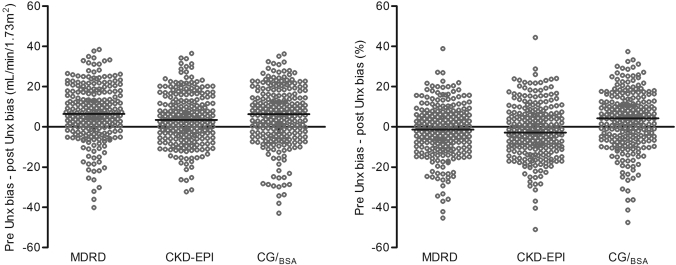
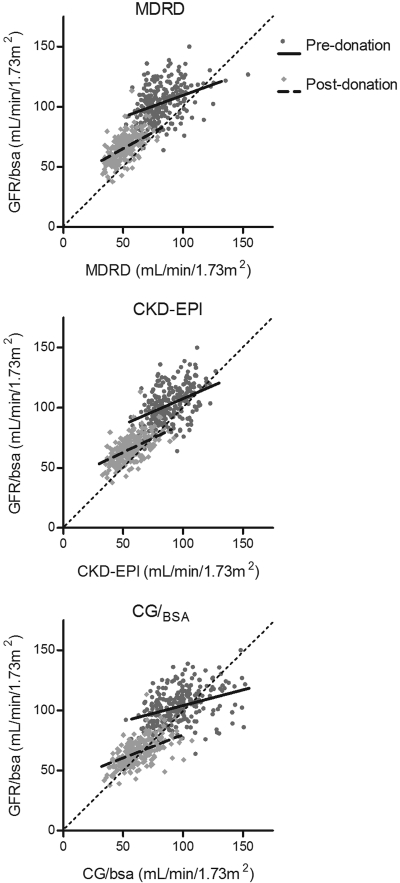
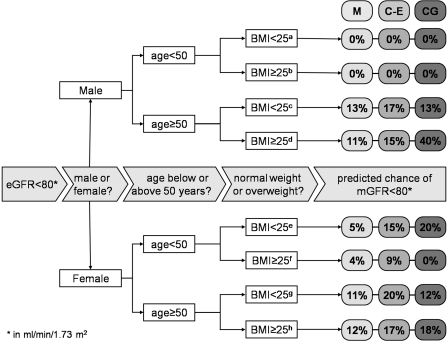
Results: mGFR declined from 103 ± 15 to 66 ± 11 ml/min per 1.73 m(2) after donation. All equations underestimated mGFR at both time points. Arithmetic performance analysis showed improved performance after donation of all equations, with significant reduction of bias after donation. Expressed as percentage difference, mGFR-estimated GFR (eGFR) bias was reduced after donation only for CG/(BSA). Finally, in 295 unselected individuals who were screened for donation, mGFR was below the cutoff for donation of 80 ml/min per 1.73 m(2) in 19 individual but in 166, 98, and 74 for MDRD, CDK-EPI, and CG/(BSA), respectively.
Conclusions: A higher level of GFR as such is associated with larger absolute underestimation of true GFR by eGFR. For donor screening purposes, eGFR should be interpreted with great caution; when in doubt, true GFR should be performed to prevent unjustified decline of prospective kidney donors.
Figures

References
-
- Rule AD, Gussak HM, Pond GR, Bergstralh EJ, Stegall MD, Cosio FG, Larson TS: Measured and estimated GFR in healthy potential kidney donors. Am J Kidney Dis 43: 112–119, 2004 - PubMed
-
- Rule AD, Larson TS, Bergstralh EJ, Slezak JM, Jacobsen SJ, Cosio FG: Using serum creatinine to estimate glomerular filtration rate: Accuracy in good health and in chronic kidney disease. Ann Intern Med 141: 929–937, 21-12-2004 - PubMed
-
- Lin J, Knight EL, Hogan ML, Singh AK: A comparison of prediction equations for estimating glomerular filtration rate in adults without kidney disease. J Am Soc Nephrol 14: 2573–2580, 2003 - PubMed
-
- Mahajan S, Mukhiya GK, Singh R, Tiwari SC, Kalra V, Bhowmik DM, Gupta S, Agarwal SK, Dash SC: Assessing glomerular filtration rate in healthy Indian adults: A comparison of various prediction equations. J Nephrol 18: 257–261, 2005 - PubMed
-
- Poggio ED, Wang X, Greene T, Van Lente F, Hall PM: Performance of the modification of diet in renal disease and Cockcroft-Gault equations in the estimation of GFR in health and in chronic kidney disease. J Am Soc Nephrol 16: 459–466, 2005 - PubMed
Publication types
MeSH terms
Substances
LinkOut - more resources
Full Text Sources
Medical
Research Materials
Miscellaneous
