. 2010 Oct;117(2):515-23.
doi: 10.1093/toxsci/kfq208. Epub 2010 Jul 8.

The oxygen tension modulates acetaminophen-induced mitochondrial oxidant stress and cell injury in cultured hepatocytes

Affiliations

The oxygen tension modulates acetaminophen-induced mitochondrial oxidant stress and cell injury in cultured hepatocytes

Hui-Min Yan et al. Toxicol Sci. 2010 Oct.

Abstract

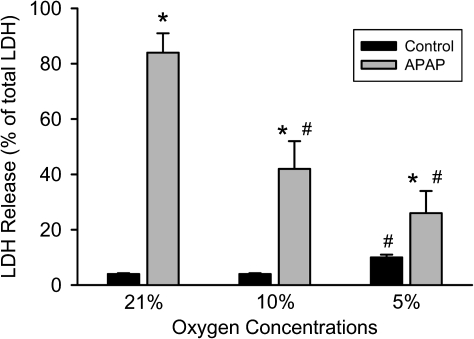
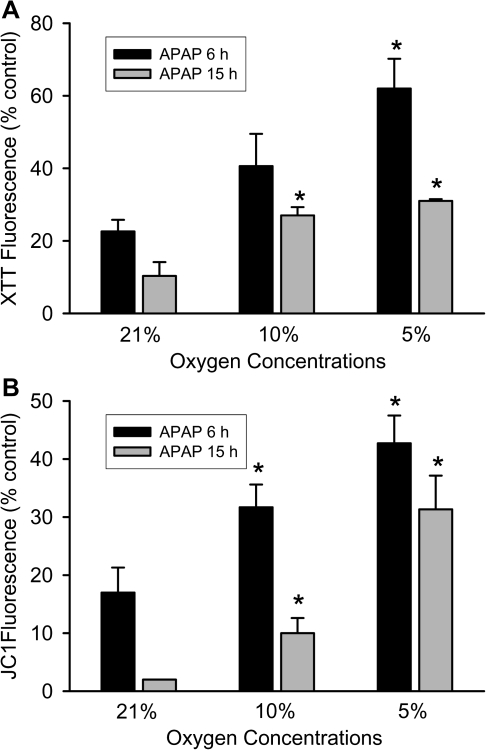
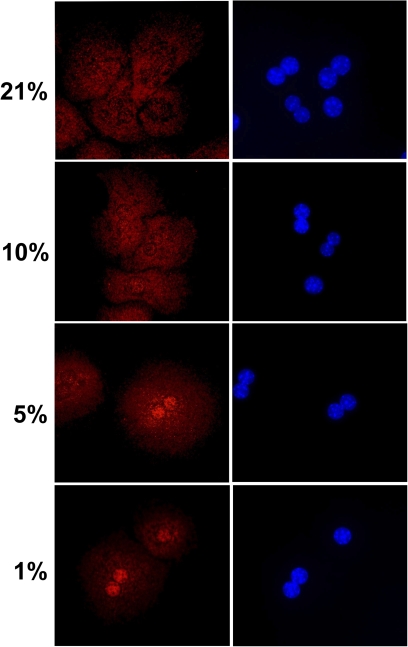
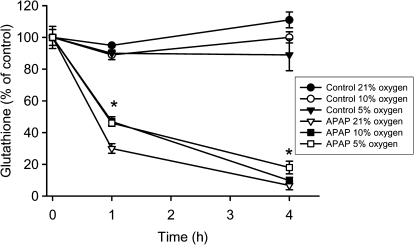
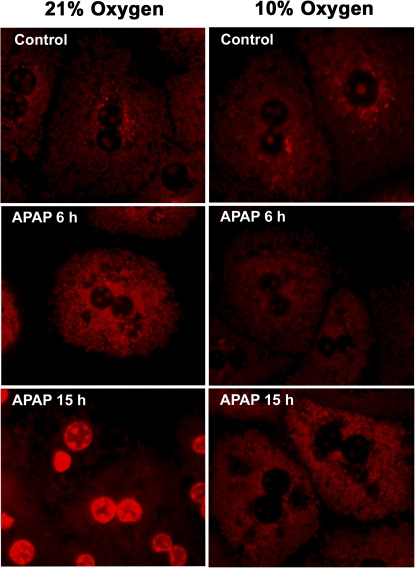
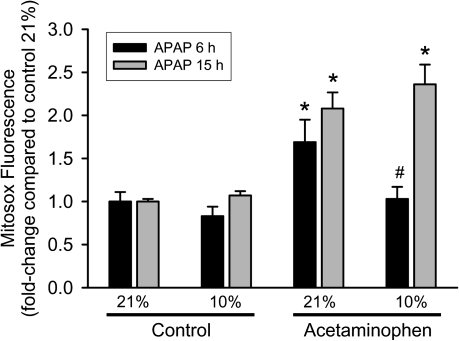
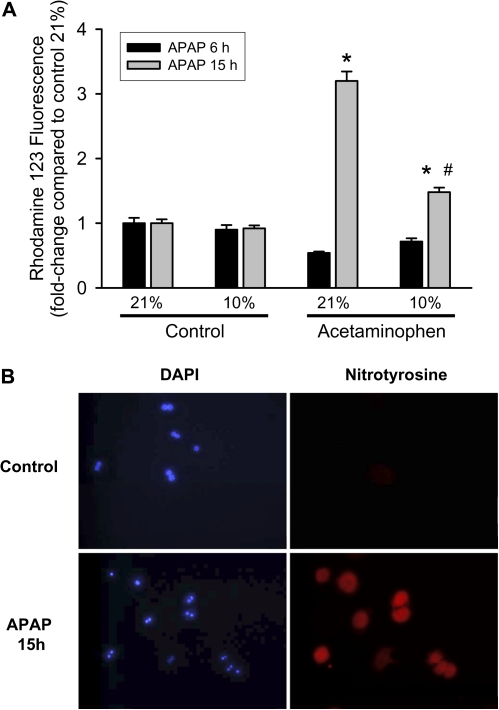
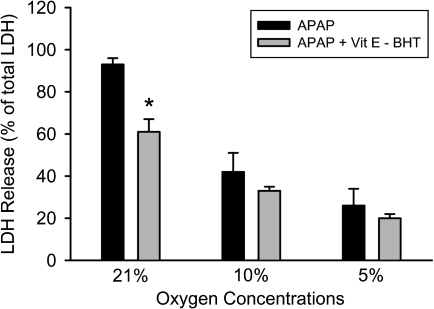
Oxidative stress and mitochondrial dysfunction play an important role in acetaminophen (APAP)-induced hepatocyte cell death. However, exact mechanisms involved in the process are controversial, in part, because of the disparity in findings between in vitro and in vivo studies. A major difference in this context is the oxygen tension, with cells in culture being exposed to 21% oxygen, whereas those in the liver experience a gradient from 3 to 9% oxygen. To determine if oxygen tensions could modulate hepatocyte responses to APAP, primary mouse hepatocytes were treated with 5mM APAP for up to 15 h under various oxygen tensions and mitochondrial dysfunction (2,3-bis[2-methoxy-4-nitro-5-sulfophenyl]-2H-tetrazolium-5-carboxyanilide inner salt assay, 5,5',6,6'-tetrachloro-1,1,3,3-tetraethylbenzimidazolylcarbocyanine iodide [JC-1] fluorescence ratio) and cell death (lactate dehydrogenase release) was evaluated. Mitochondrial reactive oxygen and reactive nitrogen species were measured using Mitosox Red or dihydrorhodamine fluorescence and nitrotyrosine staining, respectively. Exposure of hepatocytes to 5mM APAP at 21% O(2) resulted in mitochondrial oxidant stress formation, deterioration of mitochondrial function, and loss of membrane potential as early as 6 h and massive cell death at 15 h. Culture of cells at 10% O(2) resulted in no increase in mitochondrial oxidant stress and better preserved mitochondrial function at 6 h and significant protection against cell death at 15 h. Furthermore, dihydrorhodamine fluorescence was significantly attenuated at 10% oxygen. Cells cultured at 5% oxygen were also protected but showed evidence of hypoxia (accumulation of lactate and nuclear translocation of hypoxia-inducing factor-1α). These results suggest that oxygen tension can modulate hepatocyte responses to APAP, with low physiological levels (10%) decreasing mitochondrial oxidant stress and delaying hepatocyte cell death.


Figures

FIG. 1.
FIG. 1.
Necrotic cell death measured by LDH release in primary mouse hepatocytes treated with 5mM APAP after 15 h at various oxygen concentrations. Experiments were carried out as described in the Materials and Methods section. Values represent mean ± SE of n = 3 independent experiments. *p < 0.05 (when compared with respective control) and #p < 0.05 (compared with APAP-treated samples at 21% oxygen).
FIG. 2.
FIG. 2.
Mitochondrial function in primary hepatocytes after treatment with 5mM APAP for 6 or 15 h at various oxygen concentrations. Mitochondrial function (A) and membrane potential (B) were determined by reduction of XTT and JC-1 fluorescence, respectively. Data are given as percentage compared with untreated control at each oxygen concentration and time point. Values represent mean ± SE of n = 3 independent experiments. *p < 0.05 (compared with APAP-treated samples at 21% oxygen).
FIG. 3.
FIG. 3.
HIF-1α localization in primary hepatocytes exposed to various oxygen concentrations. Cells were isolated as described in the Materials and Methods section and cultured on glass coverslips at 21, 10, 5, or 1% oxygen for 1 h. Cells were then fixed and stained for HIF-1α. Panels on the left show HIF-1α, and the panels on the right show nuclear staining with DAPI.
FIG. 4.
FIG. 4.
GSH levels in untreated primary mouse hepatocytes or after treatment with 5mM APAP at 21, 10, or 5% oxygen. Experiments were carried out as described in the Materials and Methods section. Values represent mean ± SE of n = 3 independent experiments.
FIG. 5.
FIG. 5.
Mitosox fluorescence in mitochondria after treatment with 5mM APAP for 6 or 15 h at 21 or 10% oxygen. Primary mouse hepatocytes were isolated and treated with APAP; cells were loaded with Mitosox after 6 or 15 h and subjected to live cell imaging.
FIG. 6.
FIG. 6.
Mitochondrial reactive oxygen production after treatment with APAP for 6 or 15 h at 21 or 10% oxygen. Primary mouse hepatocytes were isolated and treated with APAP; cells were loaded with Mitosox after 6 or 15 h, lysed, and fluorescence measured on a spectrofluorometer. Data are expressed as mean ± SE of three independent experiments. *p < 0.05 (compared with respective control) and #p < 0.05 (compared with 21% oxygen).
FIG. 7.
FIG. 7.
Nitrotyrosine staining and rhodamine fluorescence as indicators of reactive nitrogen formation. (A) Rhodamine 123 fluorescence (reflecting RNS) in mitochondria after treatment with 5mM APAP for 6 or 15 h at 21 or 10% oxygen. Primary mouse hepatocytes were isolated and treated with APAP; cells were loaded with dihydrorhodamine after 6 or 15 h, lysed, and fluorescence measured on a spectrofluorometer. Data are expressed as mean ± SE of three independent experiments. *p < 0.05 (compared with respective control) and #p < 0.05 (compared with 21% oxygen). (B) Cells were isolated as described in the Materials and Methods section and cultured on glass coverslips at 21% oxygen for 15 h. Cells were then fixed and stained for nitrotyrosine protein adducts as indicator for peroxynitrite formation. Panels on the left show staining of nuclei with DAPI, and on the right panels, nitrotyrosine protein adducts are visualized.
FIG. 8.
FIG. 8.
Necrotic cell death measured by LDH release in primary mouse hepatocytes treated with 5mM APAP after 15 h at various oxygen concentrations. Some of the cells were pretreated for 1 h with 50μM α-tocopheryl succinate (Vit E) and 20μM BHT. Values represent mean ± SE of n = 3 independent experiments. *p < 0.05 (when compared with respective APAP control).

References

    1. Albano E, Poli G, Chiarpotto E, Biasi F, Dianzani MU. Paracetamol-stimulated lipid peroxidation in isolated rat and mouse hepatocytes. Chem. Biol. Interact. 1983;47:249–263. - PubMed
    1. Bajt ML, Cover C, Lemasters JJ, Jaeschke H. Nuclear translocation of endonuclease G and apoptosis-inducing factor during acetaminophen-induced liver injury. Toxicol. Sci. 2006;94:217–225. - PubMed
    1. Bajt ML, Farhood A, Lemasters JJ, Jaeschke H. Mitochondrial bax translocation accelerates DNA fragmentation and cell necrosis in a murine model of acetaminophen hepatotoxicity. J. Pharmacol. Exp. Ther. 2008;324:8–14. - PubMed
    1. Bajt ML, Knight TR, Farhood A, Jaeschke H. Scavenging peroxynitrite with glutathione promotes regeneration and enhances survival during acetaminophen-induced liver injury in mice. J. Pharmacol. Exp. Ther. 2003;307:67–73. - PubMed
    1. Bajt ML, Knight TR, Lemasters JJ, Jaeschke H. Acetaminophen-induced oxidant stress and cell injury in cultured mouse hepatocytes: protection by N-acetyl cysteine. Toxicol. Sci. 2004;80:343–349. - PubMed

Publication types

MeSH terms