. 2010 Jul 9;329(5988):197-200.
doi: 10.1126/science.1189457.

Step-growth polymerization of inorganic nanoparticles

Affiliations

Step-growth polymerization of inorganic nanoparticles

Kun Liu et al. Science. .

Abstract

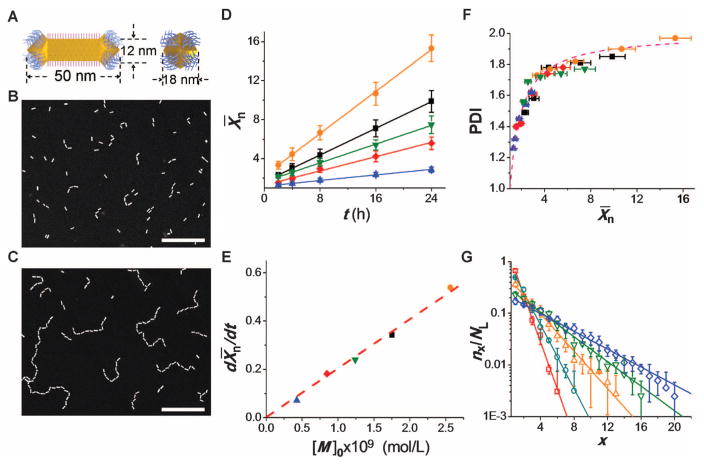
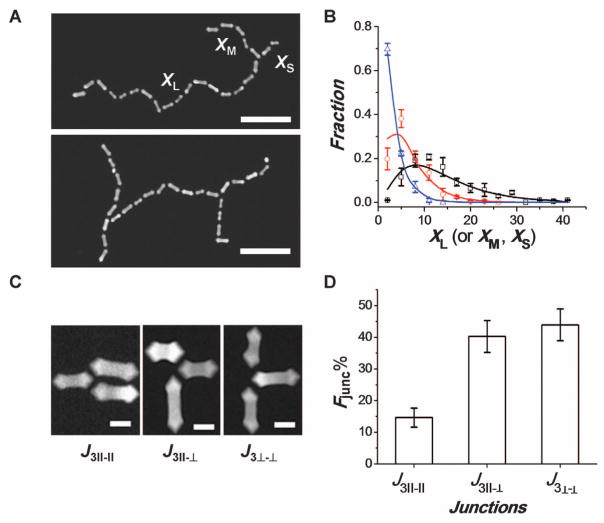
Self-organization of nanoparticles is an efficient strategy for producing nanostructures with complex, hierarchical architectures. The past decade has witnessed great progress in nanoparticle self-assembly, yet the quantitative prediction of the architecture of nanoparticle ensembles and of the kinetics of their formation remains a challenge. We report on the marked similarity between the self-assembly of metal nanoparticles and reaction-controlled step-growth polymerization. The nanoparticles act as multifunctional monomer units, which form reversible, noncovalent bonds at specific bond angles and organize themselves into a colloidal polymer. We show that the kinetics and statistics of step-growth polymerization enable a quantitative prediction of the architecture of linear, branched, and cyclic self-assembled nanostructures; their aggregation numbers and size distribution; and the formation of structural isomers.


Figures

Fig. 1
Fig. 1
Growth of colloidal polymer chains. (A) Schematics of the side view of the long face (left) and the edge (right) of the NR carrying CTAB on the long side and thiol-terminated PS molecules on the ends. (B and C) Dark-field TEM images of the NR chains after 2 (B) and 24 (C) hours assembly. [M]0 = 0.84 × 10⁻⁹ (mol/L). Scale bar, 100 nm (both panels). (D to F) Polymerization of NRs at [M]0 of 0.42 × 10⁻⁹ (solid blue triangles), 0.84 × 10⁻⁹ (solid red diamonds), 1.24 × 10⁻⁹ (solid green inverted triangles), 1.76 × 10⁻⁹ (solid black squares), and 2.56 × 10⁻⁹ (solid orange circles) (mol/L). (D)Variation in the number average degree of polymerization, n, with time t. h, hours. (E) Dependence of chain growth rate on [M]0. (F) Variation in the PDI of the chains with n. The dashed line shows the relation PDI = (2 – 1/n). For each data point in (D) and (F), the total number of NRs used in the analysis was 5000. (G) The experimental (symbols) and theoretically predicted (lines) fractions of linear x-mer chains, plotted as a function of their degree of polymerization, x, for the time of 2 (open red squares), 4 (open teal circles), 8 (open orange triangles), 16 (open green inverted triangles), and 24 (open blue diamonds) hours. [M]0 = 0.84 × 10⁻⁹ (mol/L). Error bars indicate SD.
Fig. 2
Fig. 2
Structural isomerism of the self-assembled polymer chains. (A) TEM images of the NRs linked at a bond angle of θ = 90° (left) and θ = 180° (right). (B) Variation in the distribution of bond angles for dimers (black), tetramers (red), and octamers (blue). (C) TEM images of the chains with cis-isomers (left) and trans-isomers (right). (D) Variation in the ratio of the number of trans-to-cis isomers (Rtrans/cis), plotted as a function of the number of NRs in the chain. (E) TEM images of cyclic molecules assembled at [M]0 = 0.84 × 10⁻⁹ (mol/L) and t = 6 hours. (F) Variation in the fraction of cyclic isomers (Fc), as in (E), plotted for chains with different degrees of polymerization. Scale bars in (A), (C), and (E), 50 nm. Error bars indicate SD.
Fig. 3
Fig. 3
Structure of branched NR chains. (A) TEM images of three-arm star polymer (top) and H-shaped polymer (bottom). The corresponding degrees of polymerization of the long, medium, and short arms of the star polymers are denoted as XL, XM, and XS, respectively. Scale bars, 200 nm. (B) Experimentally determined fractions of long (black squares), medium (red circles), and short (blue triangles) arms of star polymers, plotted as a function of the corresponding degrees of polymerization. Solid lines show the corresponding theoretically estimated fractions of the long (Eq. 4), medium, and short arms (eqs. S7 and S9). (C) TEM images of the junctions at branching points in NR chains. The subscripts in the notations define the number of NRs in the junction and the orientation of NRs with respect to each other. Scale bars, 20 nm. (D) Distribution of the fractions of junctions with different orientations of NRs for t = 24 hours and [M]0 = 2.56 × 10⁻⁹ mol/L. Error bars indicate SD.

References

    1. Nie Z, Petukhova A, Kumacheva E. Nat Nanotechnol. 2010;5:15. - PubMed
    1. Glotzer SC, et al. Curr Opin Colloid Interface Sci. 2005;10:287.
    1. Glotzer SC, Solomon MJ. Nat Mater. 2007;6:557. - PubMed
    1. DeVries GA, et al. Science. 2007;315:358. - PubMed
    1. Huynh WU, Dittmer JJ, Alivisatos AP. Science. 2002;295:2425. - PubMed

Publication types