. 2010 Sep 3;107(5):631-41.
doi: 10.1161/CIRCRESAHA.110.224345. Epub 2010 Jul 8.

Mitochondria control functional CaV1.2 expression in smooth muscle cells of cerebral arteries

Affiliations

Mitochondria control functional CaV1.2 expression in smooth muscle cells of cerebral arteries

Damodaran Narayanan et al. Circ Res. .

Abstract

Rationale: Physiological functions of mitochondria in contractile arterial myocytes are poorly understood. Mitochondria can uptake calcium (Ca(2+)), but intracellular Ca(2+) signals that regulate mitochondrial Ca(2+) concentration ([Ca(2+)](mito)) and physiological functions of changes in [Ca(2+)](mito) in arterial myocytes are unclear.

Objective: To identify Ca(2+) signals that regulate [Ca(2+)](mito), examine the significance of changes in [Ca(2+)](mito), and test the hypothesis that [Ca(2+)](mito) controls functional ion channel transcription in myocytes of resistance-size cerebral arteries.

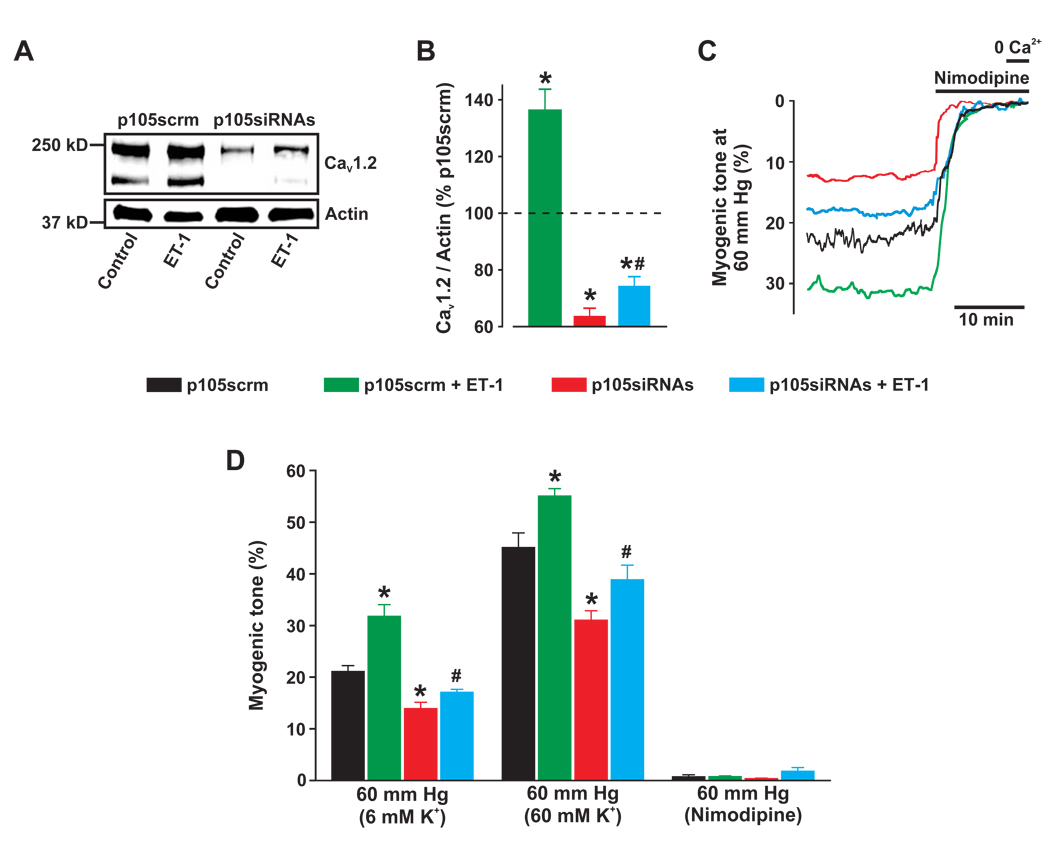
Methods and results: Endothelin (ET)-1 activated Ca(2+) waves and elevated global Ca(2+) concentration ([Ca(2+)](i)) via inositol 1,4,5-trisphosphate receptor (IP(3)R) activation. IP(3)R-mediated sarcoplasmic reticulum (SR) Ca(2+) release increased [Ca(2+)](mito) and induced mitochondrial depolarization, which stimulated mitochondrial reactive oxygen species (mitoROS) generation that elevated cytosolic ROS. In contrast, a global [Ca(2+)](i) elevation did not alter [Ca(2+)](mito), mitochondrial potential, or mitoROS generation. ET-1 stimulated nuclear translocation of nuclear factor (NF)-kappaB p50 subunit and ET-1-induced IP(3)R-mediated mitoROS elevated NF-kappaB-dependent transcriptional activity. ET-1 elevated voltage-dependent Ca(2+) (Ca(V)1.2) channel expression, leading to an increase in both pressure (myogenic tone)- and depolarization-induced vasoconstriction. Baseline Ca(V)1.2 expression and the ET-1-induced elevation in Ca(V)1.2 expression were both reduced by IP(3)R inhibition, mitochondrial electron transport chain block, antioxidant treatment, and NF-kappaB subunit knockdown, leading to vasodilation.

Conclusions: IP(3)R-mediated SR Ca(2+) release elevates [Ca(2+)](mito), which induces mitoROS generation. MitoROS activate NF-kappaB, which stimulates Ca(V)1.2 channel transcription. Thus, mitochondria sense IP(3)R-mediated SR Ca(2+) release to control NF-kappaB-dependent Ca(V)1.2 channel expression in arterial myocytes, thereby modulating arterial contractility.


Figures

Figure 1
Figure 1
ET-1 regulates local and global Ca2+ signals in arterial myocytes. A, Confocal images illustrating average fluo-4 fluorescence in myocytes in the same artery in control and ET-1 (10 nmol/L). White boxes illustrate locations where sparks occurred during 10 seconds of imaging. Colored boxes illustrate locations from where normalized fluorescence (F/F0) over time traces shown in C were determined. B, Two representative Ca2+ sparks that occurred at locations labeled in A for each condition. C, F/F0 over time traces illustrate ET-1-induced Ca2+ wave activation. D, Mean data (n=7 for each condition). P<0.05: * vs control; # vs ET-1.
Figure 2
Figure 2
ET-1-induced IP3R-mediated SR Ca2+ release elevates [Ca2+]mito in arterial myocytes. A, Confocal images illustrate colocalization of punctate 2mt8CG2 fluorescence with MitoTracker Orange in a myocyte. Colocalization quantified using weighted colocalization was 94.8±0.8% (n=10, p<0.001). B, Confocal images of 2mt8CG2 fluorescence in myocytes in the same area of a cerebral artery in control and ET-1. Scale bars=10 µm. C, Mean data for ionomycin (10 µmol/L, n=7), ET-1 (n=8), thapsigargin (100 nmol/L, n=5), ET-1+thapsigargin (n=6), XeC (20 µmol/L, n=5), ET-1+XeC (n=6), Ru360 (10 µmol/L, n=4), ET-1+Ru360 (n=4), CCCP (10 µmol/L, n=4), and 60 mmol/L K+ (n=6). ET-1 concentration was 100 nmol/L in all experiments. Thapsigargin was applied 15 minutes prior to ET-1, a time course sufficient to deplete SR Ca2+ load . P<0.05: * vs control; # vs ET-1.
Figure 3
Figure 3
ET-1-induced IP3R-mediated SR Ca2+ release depolarizes mitochondria in arterial myocytes. A, ET-1 caused reproducible mitochondrial depolarization which was blocked by XeC (20 µmol/L). B, Concentration-dependent mitochondrial depolarization by ET-1 (n=4–7). C, Mean data for ET-1 (n=37), second ET-1 application (n=12), thapsigargin (100 nmol/L, n=18), ET-1+thapsigargin (n=18), XeC (20 µmol/L, n=12), ET-1+XeC (n=12), 60 mmol/L K+ (n=10), and CCCP (10 µmol/L, n= 65). ET-1 concentration was 30 nmol/L in all experiments. P<0.05: * vs control; # vs ET-1.
Figure 4
Figure 4
ET-1-induced IP3R-mediated SR Ca2+ release elevates mitoROS generation, leading to an increase in cytosolic ROS in arterial myocytes. A, Confocal images illustrating mt-cpYFP and MitoTracker Orange fluorescence in the same myocyte. Colocalization quantified using weighted colocalization was 94.7±1.2% (n=10, p<0.001). Scale bar=10 µm. B, Mean mt-cpYFP fluorescence changes in myocytes of intact arteries. ET-1, XeC (20 µmol/L), ET-1+XeC, Ru360 (10 µmol/L), ET-1+Ru360, rotenone (10 µmol/L), ET-1+rotenone, CCCP (10 µmol/L), ET-1+CCCP, CCCP (1 nmol/L), and 60 mmol/L K+. C, Mean HyPer-CYTO fluorescence. H2O2 (100 µmol/L), ET-1 (endothelium-intact), ET-1 (endothelium-denuded), rotenone (10 µmol/L), ET-1+rotenone, MnTMPyP (10 µmol/L), and ET-1+MnTMPyP. ET-1 concentration was 100 nmol/L in all experiments. n=5 for each condition. P<0.05: * vs control; # vs ET-1.
Figure 5
Figure 5
ET-1 stimulates p50 nuclear translocation and NF-κB-dependent transcription through SR Ca2+ release and mitoROS elevation in arterial myocytes. A, Immunofluorescence images of myocytes in arteries illustrating YOYO-1 (nuclear stain, green), p50 (red), overlay, and DIC (lumenally-inserted rectangular glass cannula can be seen). B, Enlarged images indicated by boxes in A illustrate ET-1-induced elevation in p50 and YOYO-1 pixel colocalization (purple). Scale bars=20 µm. C, Mean data (n=10 for each). D, Average NF-κB-p-Luc luciferase activity with TNF-α (100 ng/ml, n=4), ET-1 (n= 5), thapsigargin (100 nmol/L, n=5), ET-1+thapsigargin (n=5), XeC (20 µmol/L, n=5), ET-1+XeC (n=5), rotenone (1 µmol/L, n=5), ET-1+rotenone (n=5), MnTMPyP (10 µmol/L, n=4), ET-1+MnTMPyP (n=4), H2O2 (100 µmol/L, n=4), and H2O2+rotenone (n=4). ET-1 concentration was 100 nmol/L in all experiments. P<0.05: * vs control; # vs ET-1; § vs rotenone or MnTMPyP.
Figure 6
Figure 6
ET-1-induced IP3R-mediated SR Ca2+ release and mitoROS elevation stimulate CaV1.2 expression in cerebral arteries. A, ET-1 elevated mean CaV1.2 mRNA (n=7). B, Western blot indicating that XeC (20 µmol/L) blocked ET-1-induced elevation in CaV1.2 expression. C, Mean data for ET-1 (n=12), XeC (20 µmol/L, n=7), ET-1+XeC (n=7), rotenone (1µmol/L, n=6), ET-1+rotenone (n=6), MnTMPyP (10 µmol/L, n=5), ET-1+MnTMPyP (n=5), H2O2 (100 µmol/L, n=5), and H2O2+rotenone (n=5). ET-1 concentration was 10 nmol/L in all experiments. P<0.05: * vs untreated; # vs ET-1; § vs rotenone or MnTMPyP.
Figure 7
Figure 7
NF-κB controls basal and ET-1-induced elevation in functional CaV1.2 expression in cerebral arteries. A, Western blot illustrating effects of p105siRNAs (10 µg/ml each) on basal and ET-1-induced CaV1.2 expression. B, Mean data. n=5 for each. C, Representative traces illustrating diameter in arteries pressurized to 60 mm Hg. Nimodipine (1 µmol/L) fully dilated p105scrm- and p105siRNAs-treated arteries. D, Mean myogenic tone at 60 mm Hg, in 60 mmol/L K+ at 60 mm Hg, and nimodipine at 60 mm Hg. n=5–6 for each. ET-1 concentration was 10 nmol/L in all experiments. P<0.05: * vs p105scrm; # vs p105siRNAs.
Figure 8
Figure 8
Proposed signaling pathways that control basal and ET-1-induced CaV1.2 expression in cerebral artery myocytes. Δψm indicates mitochondrial potential.

References

    1. Jaggar JH, Porter VA, Lederer WJ, Nelson MT. Calcium sparks in smooth muscle. Am J Physiol Cell Physiol. 2000;278:C235–C256. - PubMed
    1. Chalmers S, Olson ML, MacMillan D, Rainbow RD, McCarron JG. Ion channels in smooth muscle: regulation by the sarcoplasmic reticulum and mitochondria. Cell Calcium. 2007;42:447–466. - PubMed
    1. Poburko D, Lee CH, van Breemen C. Vascular smooth muscle mitochondria at the cross roads of Ca2+ regulation. Cell Calcium. 2004;35:509–521. - PubMed
    1. Cheranov SY, Jaggar JH. Mitochondrial modulation of Ca2+ sparks and transient KCa currents in smooth muscle cells of rat cerebral arteries. J Physiol. 2004;556:755–771. - PMC - PubMed
    1. Xi Q, Cheranov SY, Jaggar JH. Mitochondria-derived reactive oxygen species dilate cerebral arteries by activating Ca2+ sparks. Circ Res. 2005;97:354–362. - PMC - PubMed

Publication types

MeSH terms