

Breast tissue composition and susceptibility to breast cancer
- PMID: 20616353
- PMCID: PMC2923218
- DOI: 10.1093/jnci/djq239
Breast tissue composition and susceptibility to breast cancer
Abstract
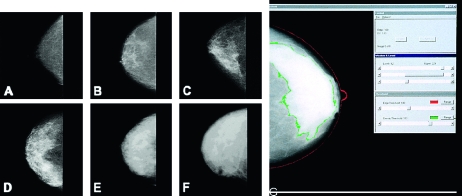
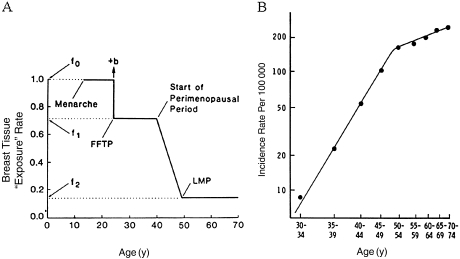
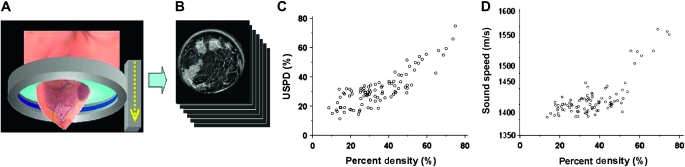
Breast density, as assessed by mammography, reflects breast tissue composition. Breast epithelium and stroma attenuate x-rays more than fat and thus appear light on mammograms while fat appears dark. In this review, we provide an overview of selected areas of current knowledge about the relationship between breast density and susceptibility to breast cancer. We review the evidence that breast density is a risk factor for breast cancer, the histological and other risk factors that are associated with variations in breast density, and the biological plausibility of the associations with risk of breast cancer. We also discuss the potential for improved risk prediction that might be achieved by using alternative breast imaging methods, such as magnetic resonance or ultrasound. After adjustment for other risk factors, breast density is consistently associated with breast cancer risk, more strongly than most other risk factors for this disease, and extensive breast density may account for a substantial fraction of breast cancer. Breast density is associated with risk of all of the proliferative lesions that are thought to be precursors of breast cancer. Studies of twins have shown that breast density is a highly heritable quantitative trait. Associations between breast density and variations in breast histology, risk of proliferative breast lesions, and risk of breast cancer may be the result of exposures of breast tissue to both mitogens and mutagens. Characterization of breast density by mammography has several limitations, and the uses of breast density in risk prediction and breast cancer prevention may be improved by other methods of imaging, such as magnetic resonance or ultrasound tomography.
Figures


Comment in
-
Re: Breast tissue composition and susceptibility to breast cancer.J Natl Cancer Inst. 2011 Jan 5;103(1):77; author reply 77-8. doi: 10.1093/jnci/djq464. Epub 2010 Nov 18. J Natl Cancer Inst. 2011. PMID: 21088279 No abstract available.
References
-
- Freedman AN, Seminara D, Gail MH, et al. Cancer risk prediction models: a workshop on development, evaluation, and application. J Natl Cancer Inst. 2005;97(10):715–723. - PubMed
-
- Ford ES, Ajani UA, Croft JB, et al. Explaining the decrease in U.S. deaths from coronary disease, 1980-2000. N Engl J Med. 2007;356(23):2388–2398. - PubMed
-
- Gail MH, Brinton LA, Byar DP, et al. Projecting individualized probabilities of developing breast cancer for white females who are being examined annually. J Natl Cancer Inst. 1989;81(24):1879–1886. - PubMed
-
- McCormack VA. dos Santos Silva I. Breast density and parenchymal patterns as markers of breast cancer risk: a meta-analysis. Cancer Epidemiol Biomarkers Prev. 2006;15(6):1159–1169. - PubMed
-
- Chen J, Pee D, Ayyagari R, et al. Projecting absolute invasive breast cancer risk in white women with a model that includes mammographic density. J Natl Cancer Inst. 2006;98(17):1215–1226. - PubMed
Publication types
MeSH terms
Substances
Grants and funding
LinkOut - more resources
Full Text Sources
Other Literature Sources
Medical
