. 2010 Aug;16(8):903-8.
doi: 10.1038/nm.2187. Epub 2010 Jul 8.

Musashi-2 regulates normal hematopoiesis and promotes aggressive myeloid leukemia

Affiliations

Musashi-2 regulates normal hematopoiesis and promotes aggressive myeloid leukemia

Michael G Kharas et al. Nat Med. 2010 Aug.

Abstract

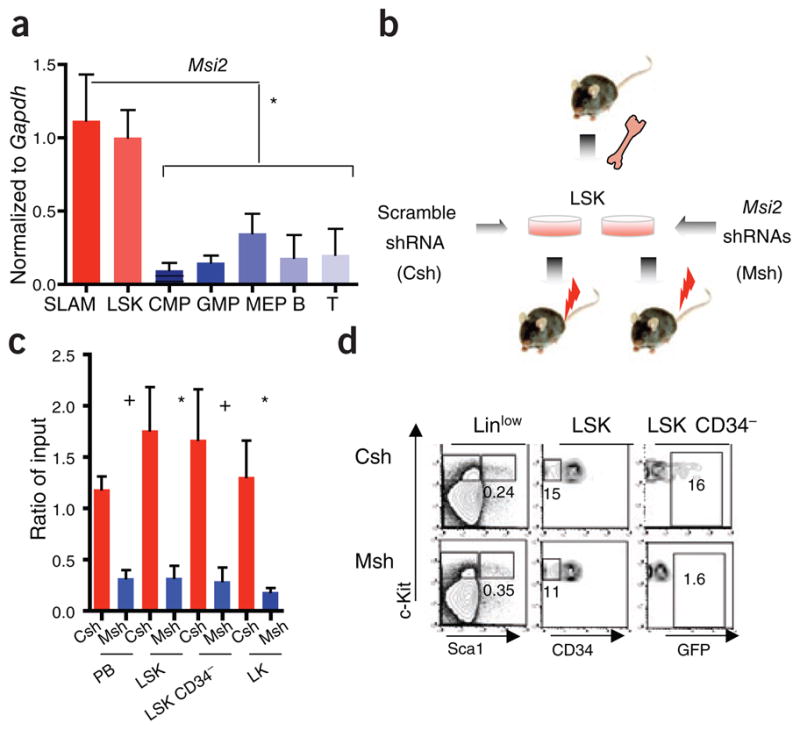
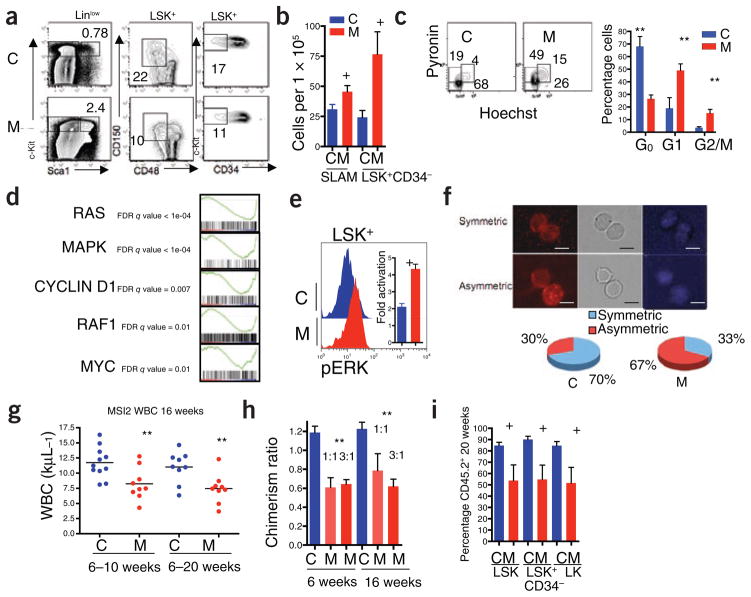
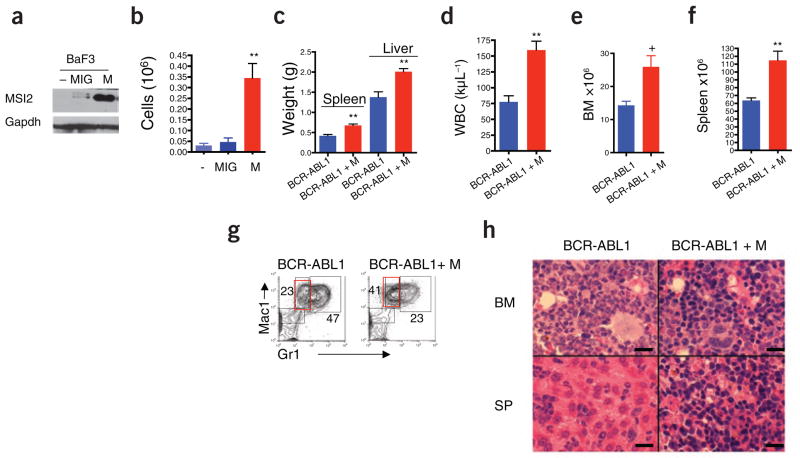
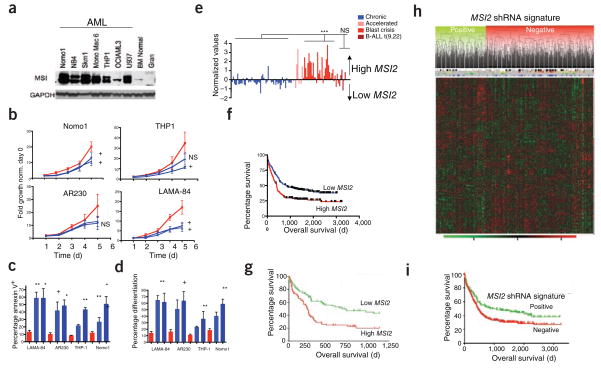
RNA-binding proteins of the Musashi (Msi) family are expressed in stem cell compartments and in aggressive tumors, but they have not yet been widely explored in the blood. Here we demonstrate that Msi2 is the predominant form expressed in hematopoietic stem cells (HSCs), and its knockdown leads to reduced engraftment and depletion of HSCs in vivo. Overexpression of human MSI2 in a mouse model increases HSC cell cycle progression and cooperates with the chronic myeloid leukemia-associated BCR-ABL1 oncoprotein to induce an aggressive leukemia. MSI2 is overexpressed in human myeloid leukemia cell lines, and its depletion leads to decreased proliferation and increased apoptosis. Expression levels in human myeloid leukemia directly correlate with decreased survival in patients with the disease, thereby defining MSI2 expression as a new prognostic marker and as a new target for therapy in acute myeloid leukemia (AML).


Conflict of interest statement

COMPETING FINANCIAL INTERESTS

The authors declare no competing financial interests.

Figures

Figure 1
Figure 1
Msi2 is expressed in HSCs, and its depletion reduces engraftment in vivo. (a) Quantitative RT-PCR of Msi2 expression in purified hematopoietic populations. SLAM, CMP, common myeloid progenitor; GMP, granulocyte monocyte progenitor; MEP, myeloerythroid progenitor; B, T, lymphocytes. Error bars represent s.e.m. for at least four experiments. (b) Strategy for Msi2 shRNA knockdown in vivo. Viral vectors carrying control scrambled shRNA (Csh) or shRNAs targeting Msi2 (Msh) along with EGFP were transduced into LSK cells followed by transplant into lethally irradiated mice (red bolts). (c) Relative engraftment of whole peripheral blood (PB) and purified bone marrow stem and progenitor cell populations (LSK, Linlow Sca+ c-Kit+; long-term HSC, LSK CD34+; LK, LinlowScac-Kit+) by cells infected with shRNA (Msh or Csh at 6 weeks after transplant. The ratio of EGFP+ cells in the indicated populations is relative to input (representative of three independent transplants and at least eight mice; NS, not significant, +P < 0.05, *P < 0.01, statistical nomenclature used throughout subsequent figures). (d) Representative flow cytometric analysis of bone marrow stem and progenitor cells from engrafted mice at 6 weeks after transplant.
Figure 2
Figure 2
Ectopic MSI2 expression compromises HSC function. Bone marrow from control rtTA (C) or MSI2-transgenic (M) mice was transplanted into irradiated CD45.1+ congenic mice. Six weeks after transplantation, doxycycline was given for 5 d, and bone marrow was analyzed for HSC and progenitor cells. (a) Representative flow cytometric plots, with percentages of cells expressing markers as indicated. The analyzed populations are indicated above the plots. (b) Quantification of long-term HSCs (SLAM: LSK CD150+CD48+ or LSK CD34). (c) Cell cycle analysis performed with Hoechst and pyronin Y, gated on hematopoietic stem and progenitor cells (LSK cells) (representative experiment from at least seven mice; error bars, s.e.m.). (d) Gene set enrichment analysis (GSEA) on microarray data of MSI2-overexpressing LSKs (Supplementary Methods). (e) Determination of ERK phosphorylation in LSKs after stimulation with SCF. Representative plot shown; histogram indicates combined analysis of five mice from two independent experiments. (f) Determination of symmetric versus asymmetric cell divisions in purified LSKs. Immunofluorescence images stained for Numb (left) and DAPI (right) and bright field (middle). Scale bars, 10 μm. A quantification is presented as pie charts below the images (C, n = 4 experiments, 70% symmetric ± 9.2% (n = 58 cells) and M, n = 5 experiments, 33% symmetric ± 13.2% (n = 61 cells), P < 0.004). (g) White blood cell counts (WBC) in recipient mice administered doxycycline for the indicated lengths of time. Each point represents one mouse; the line indicates the mean WBC of the cohort. (h) Analysis of relative engraftment in peripheral blood after competitive transplants in which MSI2-transgenic (M), or control rtTA (C), bone marrow (CD45.2+) was mixed with competitor wild-type marrow (CD45.1+) at the indicated ratios. (i) Percentage CD45.2+ cells in the long-term HSC (LSK CD34), LSK and LK cell compartments in the bone marrow of mice transplanted with a 3:1 ratio of MSI2- or rtTA-expressing (CD45.2+) cells to wild-type cells (CD45.1+) at 20 weeks after transplantation, +P < 0.05, **P < 0.001.
Figure 3
Figure 3
Ectopic MSI2 cooperates with BCR-ABL1 in promoting leukemia progression. (a) Immunoblot of BaF3 cells transduced with control vector MSCV-IRES-EGFP (MIG) or vector carrying MSI2 (M). (b) Numbers of EGFP+ BaF3 cells remaining 4 d after cytokine withdrawal. Representative of five independent experiments from two independent clones, details in Supplementary Methods. (cf) Analysis of disease parameters including spleen and liver weight (c), white blood cell count (d) and bone marrow and spleen cellularity (e,f) in diseased mice killed at 14 d (representative of ten mice per group and two independent assays). (g) Flow cytometric analysis of spleen cells from leukemic mice, stained for Mac1 and Gr1 and gated on BCR-ABL1+GFP+ cells. Average percentages for the diseased cohort are indicated near gates for Mac1highGr1high and Mac1highGr1low populations, +P < 0.05, **P < 0.001. Supplementary Figure 10c contains statistical analyses. (h) H&E staining of bone marrow (BM) and spleen (SP) from diseased mice. Scale bars, 250 μm.
Figure 4
Figure 4
Increased MSI2 expression in human myeloid leukemias is associated with aggressive disease and immature phenotype. (a) Immunoblot analysis in human AML cell lines, normal human bone marrow cell and granulocytes. The MSI2 doublet indicates two alternative isoforms from the MSI2 gene. (b) Cell proliferation in the indicated cell lines after infection with lentivirus expressing control or MSI2-specific shRNAs. Error bars indicate s.e.m. from at least five independent experiments per cell line scramble control (red) and two different shRNAs (blue). (c,d) Apoptosis and differentiation based on annexin staining and CD16, CD11b staining. A representative flow cytometric plot is shown in Supplementary Figure 11d; error bars represent s.e.m. from at least three independent experiments. +P < 0.05, *P < 0.01, **P < 0.001. (e) Analysis of Oncomine gene expression data with increased MSI2 expression in myeloid blast crisis (n = 33) versus chronic phase (n = 57, P < 0.001),, accelerated phase (n = 9) and lymphoid leukemia (B-ALL; n = 6). (f) Survival analysis in human subjects (n = 436) of the Bullinger data set stratified by MSI2 expression. MSI2 high and low expression is detailed in the Supplementary Methods, (median survival, 693 d versus 238 d; P = 0.0004. (g) Survival analysis in human subjects (n = 163), in the Metzeler data set for the cohort of CN-AML divided by MSI2 expression. (h) Unsupervised clustering of the MSI2 shRNA gene signature in the human subjects from the Bullinger data set in f. Gene expression patterns of the subjects with the positive cluster represents subjects that fit with the MSI2–knocked-down gene signature, whereas the negative cluster represents subjects that cluster into a separate group from the shRNA gene signature. Subjects with MSI2-high expression in red and MSI2-low expression in green are plotted above the clustering based on f. The FLT3 internal tandem mutation is indicated by blue lines, and NPM1 status is indicated with black lines. (i) Overall survival plot of positive correlation and negative correlation clusters from the MSI2 shRNA gene expression signature in h. P < 0.004.

Comment in

References

    1. Sakakibara S, et al. RNA-binding protein Musashi family: roles for CNS stem cells and a subpopulation of ependymal cells revealed by targeted disruption and antisense ablation. Proc Natl Acad Sci USA. 2002;99:15194–15199. - PMC - PubMed
    1. Wang XY, et al. Musashi1 modulates mammary progenitor cell expansion through proliferin-mediated activation of the Wnt and Notch pathways. Mol Cell Biol. 2008;28:3589–3599. - PMC - PubMed
    1. Tenen DG. Disruption of differentiation in human cancer: AML shows the way. Nat Rev Cancer. 2003;3:89–101. - PubMed
    1. Barbouti A, et al. A novel gene, MSI2, encoding a putative RNA-binding protein is recurrently rearranged at disease progression of chronic myeloid leukemia and forms a fusion gene with HOXA9 as a result of the cryptic t(7;17)(p15;q23) Cancer Res. 2003;63:1202–1206. - PubMed
    1. Hemmati HD, et al. Cancerous stem cells can arise from pediatric brain tumors. Proc Natl Acad Sci USA. 2003;100:15178–15183. - PMC - PubMed

Publication types

MeSH terms