

Review
doi: 10.3390/ijerph7041302.
Epub 2010 Mar 26.
Spatial modeling in environmental and public health research
Affiliations
- PMID: 20617032
- PMCID: PMC2872363
- DOI: 10.3390/ijerph7041302
Item in Clipboard
Review
Spatial modeling in environmental and public health research
Int J Environ Res Public Health.
2010 Apr.
Abstract
THIS PAPER HAS TWO AIMS: (1) to summarize various geographic information science methods; and (2) to provide a review of studies that have employed such methods. Though not meant to be a comprehensive review, this paper explains when certain methods are useful in epidemiological studies and also serves as an overview of the growing field of spatial epidemiology.
Keywords: GIS; air pollution; autocorrelation; overlay; remote sensing; spatial modelling; spatial regression.
Figures
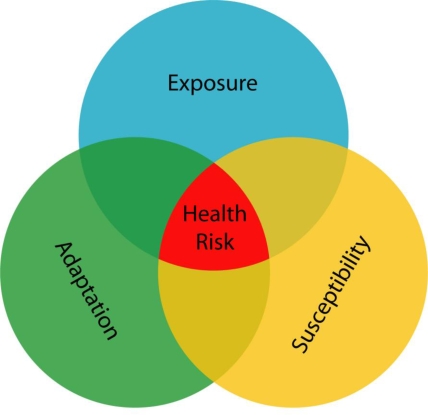
Extended Conceptual Framework for Spatial Analysis in Epidemiology and Public Health (Adapted from Jerrett, Gale and Kontgis, 2009 [3]).
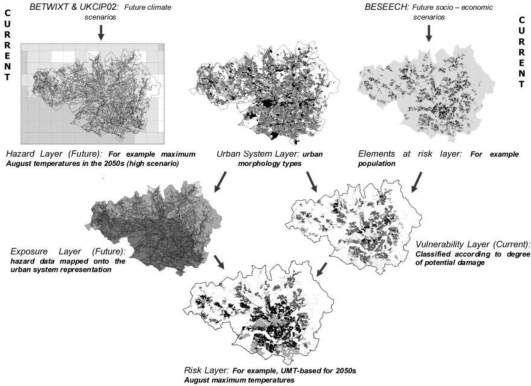
Application of conurbation-scale risk assessment. Lindley et al. overlay several different input values for climate change to develop a risk map to show areas most affected by climate change in Manchester, UK.
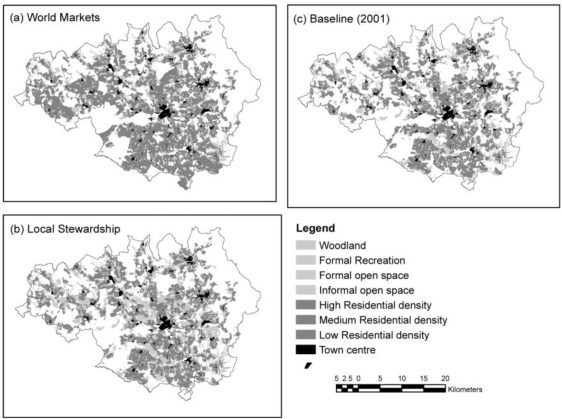
Using conurbation-scale risk assessment to analyze heat stress risk. This figure is adapted from Lindley, et al. (2007) to show the projected greenspace and residential characteristics for Manchester, UK in the 2050s in maps (a) and (b). These characteristics are based on different socio-economic scenarios with map (c) representing the baseline in 2001. For more details regarding these methods, refer to Lindley et al. (2007).
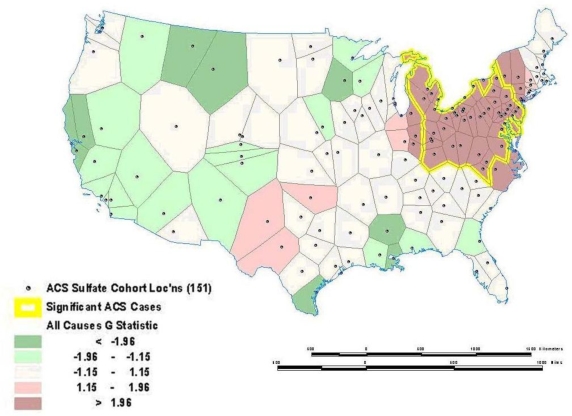
Local Mortality Cluster as Measured by the Getis-Ord Statistic (from ACS cohort). Residual mortality unexplained by 44 individual risk factors (e.g., smoking) with a significant cluster of high residual mortality shown in the darker pink color with the yellow outline as estimated by the Getis-Ord Autocorrelation Statistic.
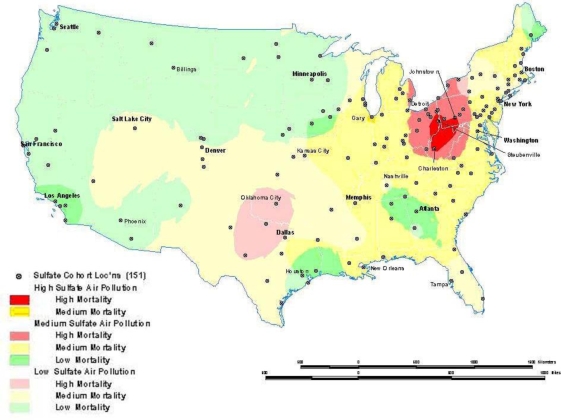
Sulfate Air Pollution and All Cause Mortality Overlay Map (from ACS cohort). Overlay showing intersection between the residual mortality discussed above in Figure 4 and tertiles of sulfate particulate air pollution. The overlay is suggestive of an association between high residual mortality not explained by individual risk factors such as smoking and high air pollution.
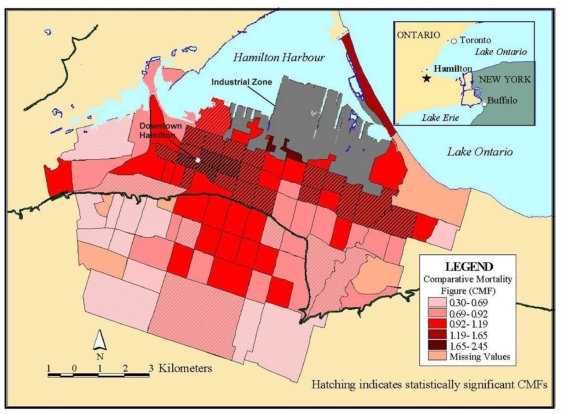
Comparative Mortality Figures for Men Ages 0−74 in Hamilton (1985−94). Comparative mortality figures allow for age standardization using methods similar to a standardized mortality index (see Fleiss 1981 [20] for more detail).
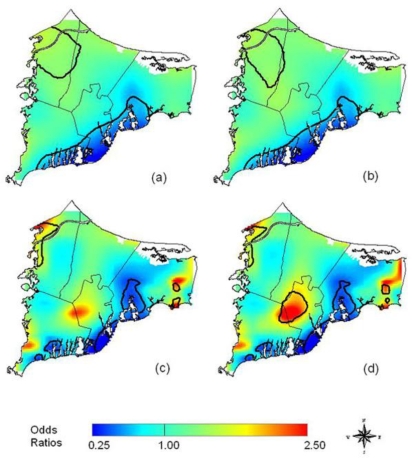
An example of maps created using Generalized Additive Modeling techniques by Webster, et al.
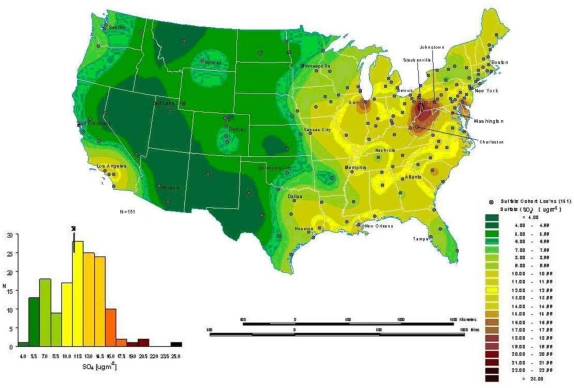
Modeled Mean Concentrations of Ambient Sulfates in the ACS Study.
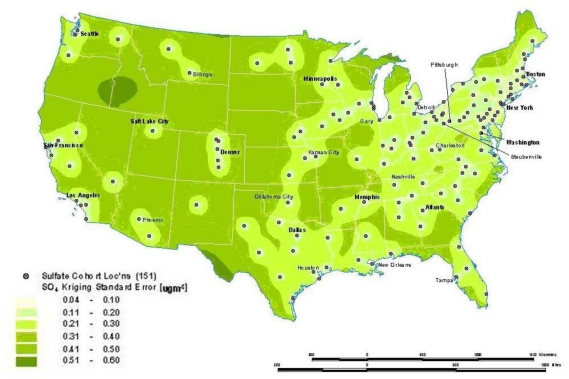
Standard Estimation Error Associated with Interpolated Concentrations of Ambient Sulfate Using Kriging.
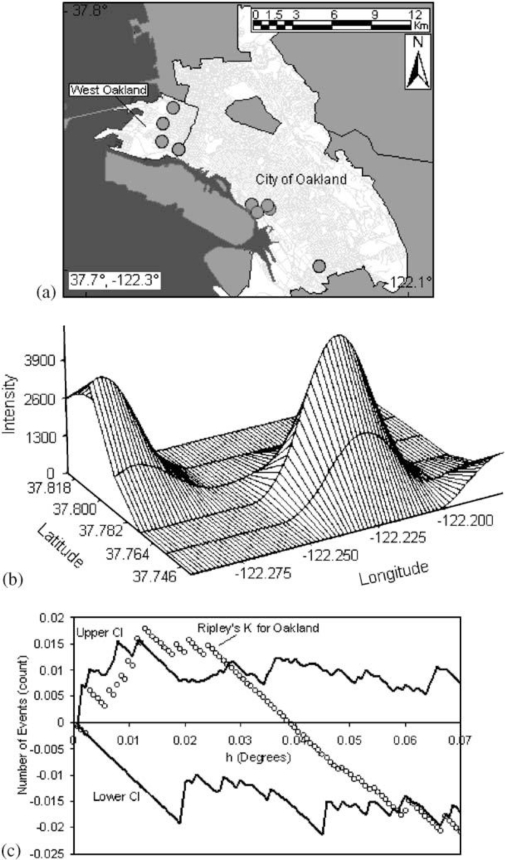
(a) TRI facilities in the city of Oakland, CA (b) Intensity distribution of TRI facilities in the city of Oakland, CA (c) Ripley’s K function for TRI facilities in the city of Oakland.
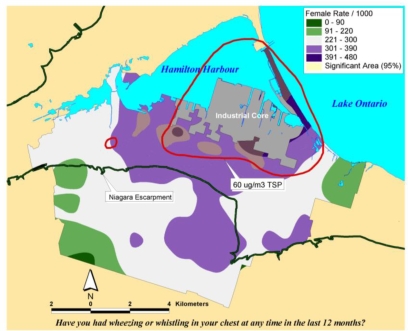
Overlay Map of TSP Exceedance Zone on Interpolated Female Asthma Indicator Rates. Areas within the red isolines indicate zones where the regulatory standard for total suspended particulate matter was exceeded. Areas showing in yellow hatching overlapping with the blue and purple shading indicated rates of asthma symptoms that exceed what would be expected by chance based on a Monte Carlo simulation.
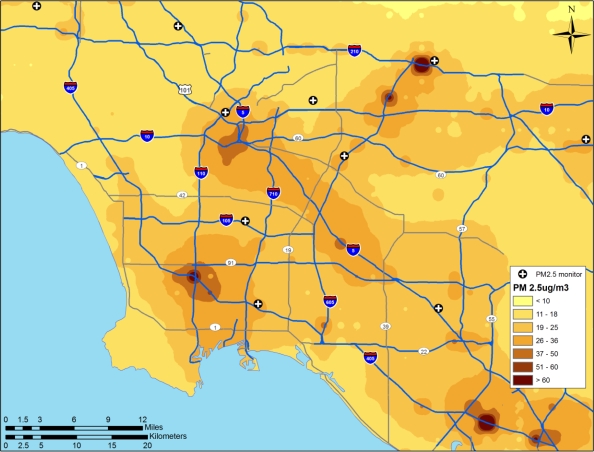
Land use regression prediction surface of particulate matter less than 2.5 microns in diameter (see Moore et al. 2007 [31] for more detail on the derivation of the land use regression model).
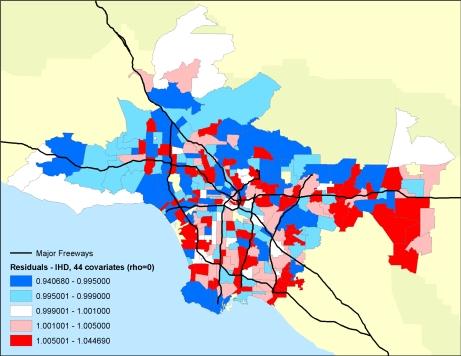
Residual mortality in ZIP code areas after controlling for 44 individual confounders and age, race and sex. Rho represents a spatial autocorrelation term, which was set to zero in this example.
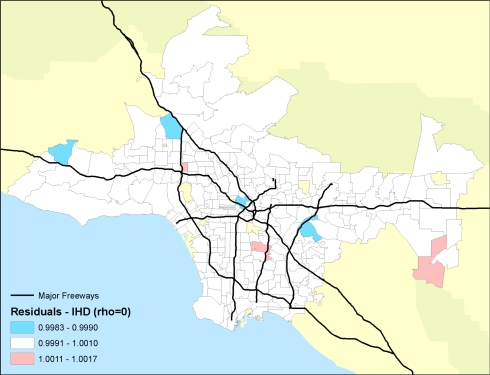
Residual (relative risks of mortality) mortality in ZIP code areas after controlling for 44 individual confounders and age, race and sex with the PM2.5 pollution term or autocorrelation term included. Note the decline in the amount of and spatial pattern in the residual mortality.
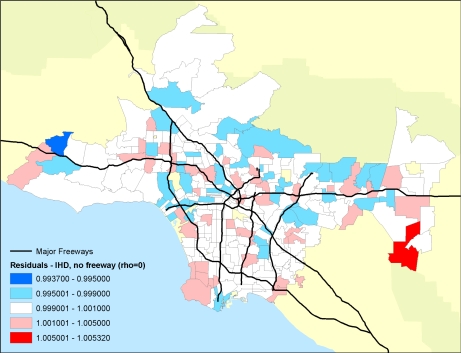
Residual mortality in ZIP code areas after controlling for 44 individual confounders and age, race and sex with the PM2.5 pollution and freeway pollution terms included. Note the further decline in the residual mortality and the associated spatial pattern.
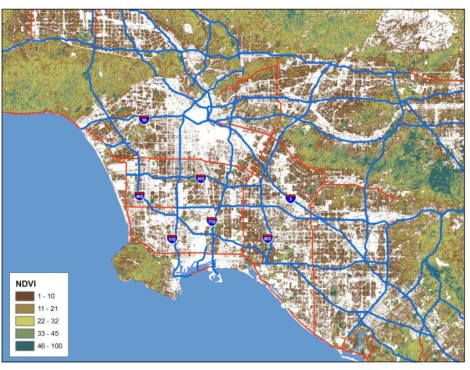
Normalized Difference Vegetation Index for the Los Angeles Metropolitan Area based on Landsat Imagery. Compare to Figure 13 to see the similarities between areas of high pollution and low vegetation.
References
-
- Mayer JD. The role of spatial-analysis and geographic data in the detection of disease causation. Soc. Sci. Med. 1983;17:1213–1221. - PubMed
-
- Jerrett M, Finkelstein M. Geographies of risk in studies linking chronic air pollution exposure to health outcomes. J. Toxicol. Environ. Health Pt A. 2005;68:1207–1242. - PubMed
-
- Jerrett M, Gale S, Kontgis C. An environmental health geography of risk. In: Brown T, McLafferty S, Moon G, editors. A Companion to Health and Medical Geography. 1st ed. Wiley-Blackwell; West Sussex, UK: 2010. pp. 418–445.
-
- Bailey TC, Gatrell AC. Interactive Spatial Data Analysis. Longman; Harlow, UK: 1995. - PubMed
-
- Clarke K. Prentice Hall: Upper Saddle River, NJ, USA; 1998. Getting Started with GIS.
Publication types
MeSH terms
Grants and funding
LinkOut - more resources
Full Text Sources
