. 2010 Jul 1;6(7):e1000843.
doi: 10.1371/journal.pcbi.1000843.

Intergenic and repeat transcription in human, chimpanzee and macaque brains measured by RNA-Seq

Affiliations

Intergenic and repeat transcription in human, chimpanzee and macaque brains measured by RNA-Seq

Augix Guohua Xu et al. PLoS Comput Biol. .

Abstract

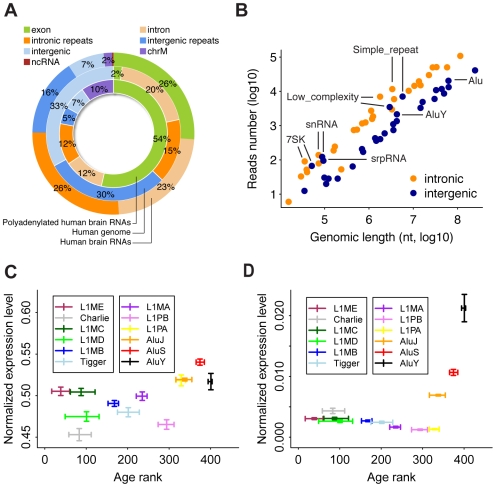
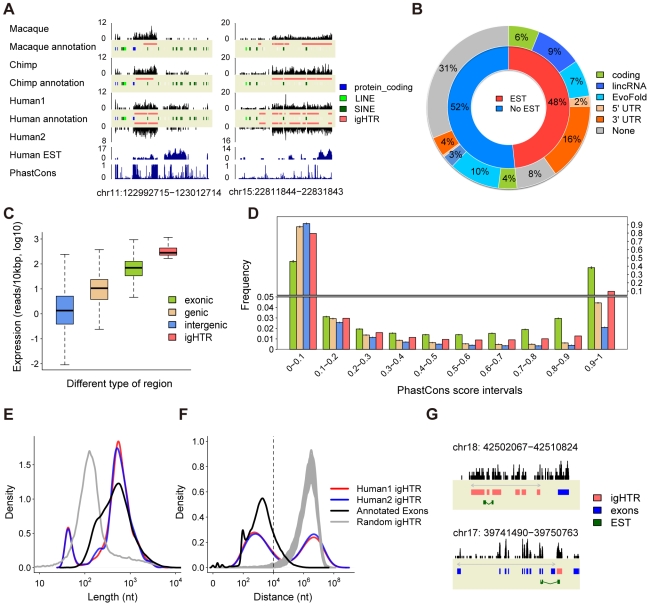
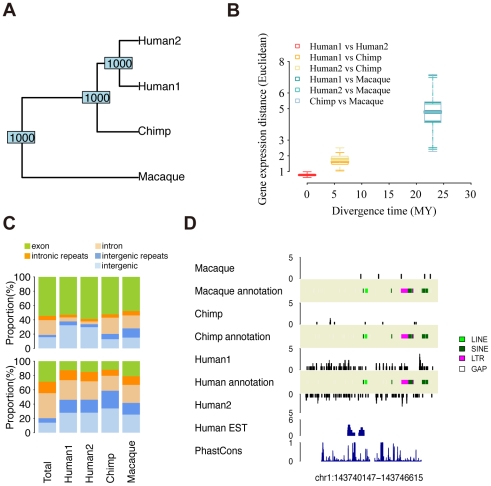
Transcription is the first step connecting genetic information with an organism's phenotype. While expression of annotated genes in the human brain has been characterized extensively, our knowledge about the scope and the conservation of transcripts located outside of the known genes' boundaries is limited. Here, we use high-throughput transcriptome sequencing (RNA-Seq) to characterize the total non-ribosomal transcriptome of human, chimpanzee, and rhesus macaque brain. In all species, only 20-28% of non-ribosomal transcripts correspond to annotated exons and 20-23% to introns. By contrast, transcripts originating within intronic and intergenic repetitive sequences constitute 40-48% of the total brain transcriptome. Notably, some repeat families show elevated transcription. In non-repetitive intergenic regions, we identify and characterize 1,093 distinct regions highly expressed in the human brain. These regions are conserved at the RNA expression level across primates studied and at the DNA sequence level across mammals. A large proportion of these transcripts (20%) represents 3'UTR extensions of known genes and may play roles in alternative microRNA-directed regulation. Finally, we show that while transcriptome divergence between species increases with evolutionary time, intergenic transcripts show more expression differences among species and exons show less. Our results show that many yet uncharacterized evolutionary conserved transcripts exist in the human brain. Some of these transcripts may play roles in transcriptional regulation and contribute to evolution of human-specific phenotypic traits.


Conflict of interest statement

The authors have declared that no competing interests exist.

Figures

Figure 1
Figure 1. Composition of human brain transcriptome and transcription of repetitive elements.
(A) Outer circle: average proportions of transcriptome sequence reads from the two human samples that map within annotated exons (green), introns (light orange), intronic repeats (orange), intergenic repeats (blue), intergenic regions (light blue), mitochondrial DNA (purple), and ncRNA (maroon). Middle circle: the proportions occupied by the corresponding regions in the human genome. Inner circle: the proportions of transcriptome sequence reads for polyadenylated human brain RNA (data adopted from [26]). (B) The transcriptional activity of repeat families located within introns (orange) or intergenic regions (blue) plotted against the total genomic length occupied by the family (see Materials and Methods for details). The labels indicate the repeat families with elevated expression levels. (C and D) The expression levels of twelve TE families normalized by the total genomic length of the corresponding family (C) and by the length corresponding to expressed repeats (D), plotted against their age rank. The expression level 95% confidence intervals are calculated by 1,000 bootstraps over sequence reads. The age rank and the corresponding confidence intervals are plotted according to . Higher age rank corresponds to evolutionary younger TE families.
Figure 2
Figure 2. Characteristics of intergenic transcripts.
(A) Examples of igHTR. The black track shows sequence reads density (in counts) in the four samples studied. The blue tracks show human EST density and PhastCon scores. (B) igHTR categories. The inner circle shows the proportion of igHTR with (red) or without (blue) EST support. The outer circle shows proportions of igHTR with protein-coding potential (green), supported by lincRNA (blue) or EvoFold (light blue) ncRNA predictions, adjacent to gene's 5′-UTR (light orange) or 3′-UTR (orange), and uncharacterized igHTR (grey) among EST-supported and non-supported igHTR. (C) Expression levels within intergenic regions (blue), genic regions including both exons and introns (light orange), exons (green), and igHTR (red). (D) Sequence conservation of nucleotides in human exons, genic regions, intergenic regions, and igHTR (all colors as on the panel (C)) based on phastCon scores among 18 placental vertebrates genomes. PhastCon scores close to 1 indicate high conservation. The heights of the bars show mean value and error bars show 95% confident intervals based on sampling of the same number of nucleotides as located within igHTR from the corresponding genomic regions 1,000 times. For igHTR, the values are based on all nucleotides located within them. (E) Size distributions of igHTR in the two human samples (red - Human1, blue - Human2), annotated human exons (grey), and exonic HTR (black) (F) Distributions of genomic distances between nearest pairs of igHTR (red – Human1, blue – Human2), annotated exons (black), and simulated randomly distributed igHTR (grey). The dashed line shows 10 kb distance. (G) Examples of splicing within igHTR clusters (red) and between annotated genes (blue) and downstream igHTR supported by EST (green).
Figure 3
Figure 3. Transcription divergences.
(A) UPGMA tree based on the expression level of 13,832 genes in 4 sample pools. The numbers at the nodes indicate node stability in 1,000 bootstraps over genes. (B) The gene expression divergence between sample pairs plotted against the species divergence time. The box plot represents variation of the divergence estimated from 1,000 bootstraps over genes (same set of genes as (A), see Materials and Methods). (C) The upper panels show genomic annotation of nucleotides covered by at least one sequence read within all HTR identified in at least one sample (Total) and HTR with species-specific expression. Genomic locations of species-specific HTR are listed in Table S8. The lower panels show genomic annotation of nucleotides covered by at least one sequence read within all genomic windows (Total) and genomic windows with species-specific expression. Locations of species-specific genomic windows are listed in Table S10. The colors represent: exons (green), intronic repeats (orange), introns (light orange), intergenic repeats (blue), and intergenic regions (light blue). (D) An example of a genomic window with human-specific expression.

References

    1. van Bakel H, Hughes TR. Establishing legitimacy and function in the new transcriptome. Brief Funct Genomic Proteomic. 2009;8:424–436. - PubMed
    1. Mercer TR, Dinger ME, Mattick JS. Long non-coding RNAs: insights into functions. Nat Rev Genet. 2009;10:155–159. - PubMed
    1. Yeo G, Holste D, Kreiman G, Burge CB. Variation in alternative splicing across human tissues. Genome Biol. 2004;5:R74. - PMC - PubMed
    1. Pan Q, Shai O, Lee LJ, Frey BJ, Blencowe BJ. Deep surveying of alternative splicing complexity in the human transcriptome by high-throughput sequencing. Nat Genet. 2008;40:1413–1415. - PubMed
    1. King MC, Wilson AC. Evolution at two levels in humans and chimpanzees. Science. 1975;188:107–116. - PubMed

Publication types

Substances