Comparative Study
. 2010 Jul 1;6(7):e1001011.
doi: 10.1371/journal.pgen.1001011.

Comparative analysis of DNA replication timing reveals conserved large-scale chromosomal architecture

Affiliations
Comparative Study

Comparative analysis of DNA replication timing reveals conserved large-scale chromosomal architecture

Eitan Yaffe et al. PLoS Genet. .

Abstract

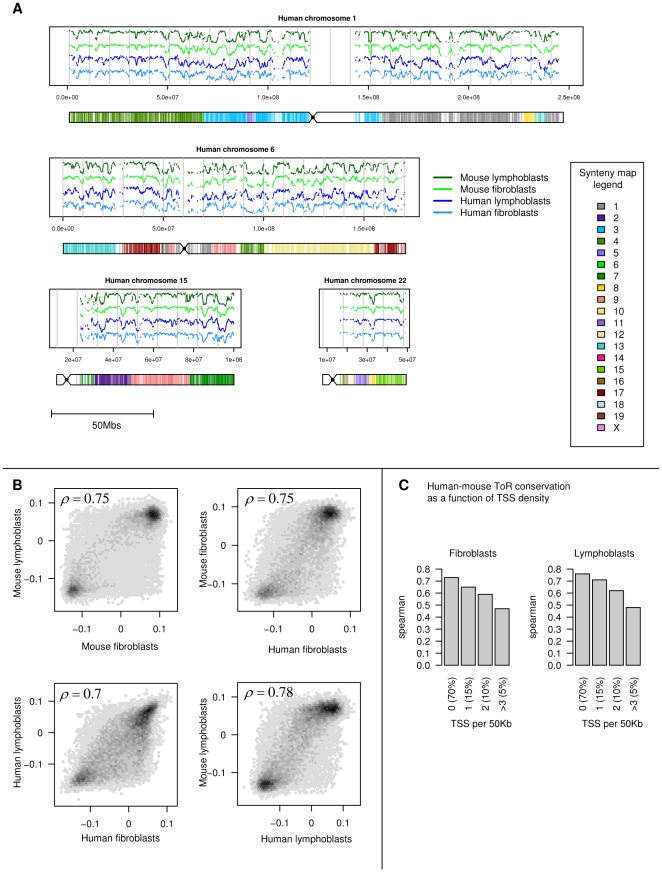
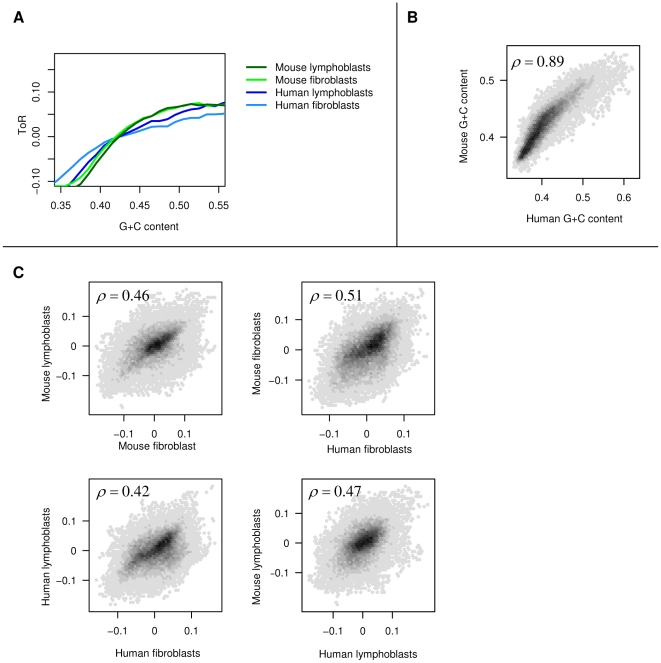
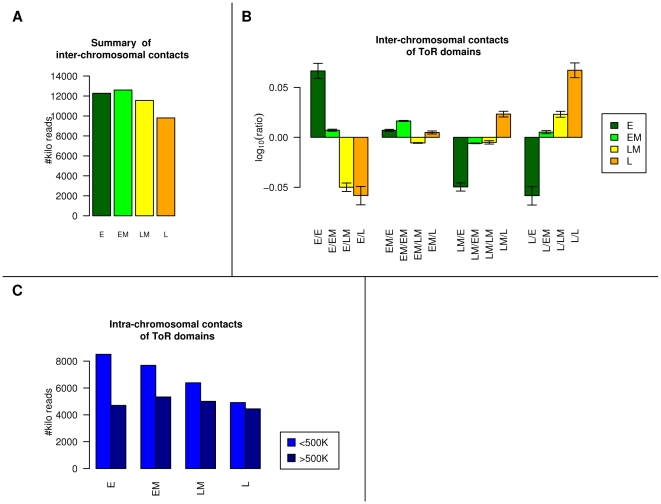
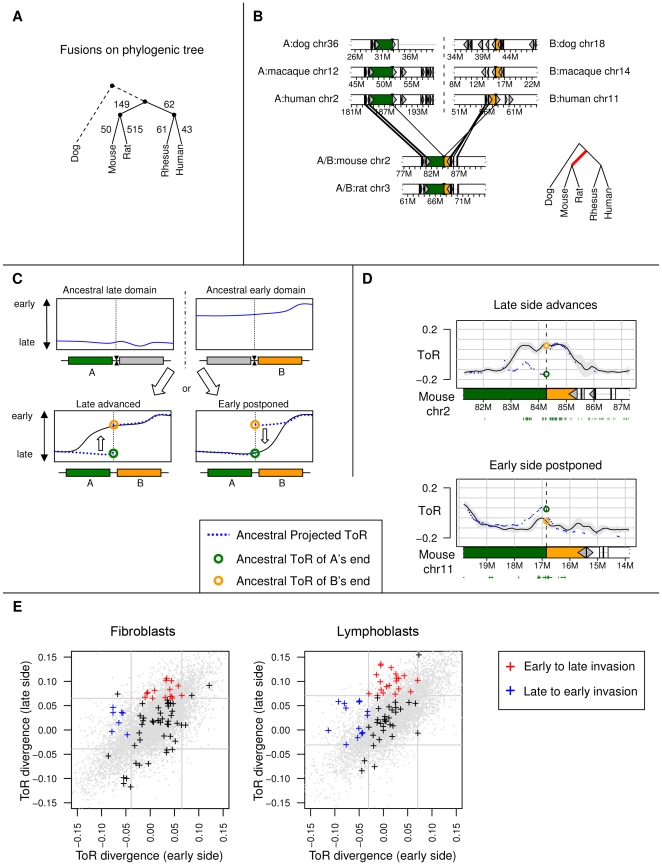
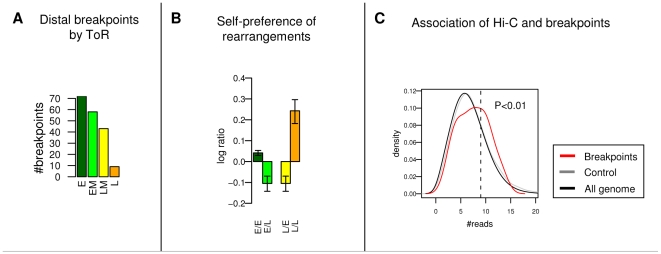
Recent evidence suggests that the timing of DNA replication is coordinated across megabase-scale domains in metazoan genomes, yet the importance of this aspect of genome organization is unclear. Here we show that replication timing is remarkably conserved between human and mouse, uncovering large regions that may have been governed by similar replication dynamics since these species have diverged. This conservation is both tissue-specific and independent of the genomic G+C content conservation. Moreover, we show that time of replication is globally conserved despite numerous large-scale genome rearrangements. We systematically identify rearrangement fusion points and demonstrate that replication time can be locally diverged at these loci. Conversely, rearrangements are shown to be correlated with early replication and physical chromosomal proximity. These results suggest that large chromosomal domains of coordinated replication are shuffled by evolution while conserving the large-scale nuclear architecture of the genome.


Conflict of interest statement

The authors have declared that no competing interests exist.

Figures

Figure 1
Figure 1. Conservation of time of replication in human and mouse cells.
(A) Conservation of the replication profiles. Shown are ToR profiles for human chromosomes 1, 6, 15 and 21 for human fibroblasts (FFT, light blue), human lymphoblasts (MOLT4, dark blue), and the orthologous time of replication profiles in mouse embryonic fibroblasts (MEF, light green), and mouse lymphoblasts (L1210, dark green). Below each chromosome we show the human-mouse synteny map, color coded according to the corresponding mouse chromosomes. (B) Cross-tissue and species correlations. A two-way comparison between the two human and two mouse ToR profiles. Spearman correlation coefficients are specified in each scatter plot. (C) ToR conservation is higher in gene deserts than in gene rich domains. ToR spearman correlation (human versus mouse) as a function of gene density, represented by the number of transcription start sites per 50kb window.
Figure 2
Figure 2. G+C content conservation does not explain ToR conservation.
(A) Fitting ToR to G+C content. Shown are moving averages of ToR as a function of G+C content (in 50Kb bins) for the four ToR profiles (using 50 equal-sized G+C content bins ranging between 0.2 and 0.7). (B) Conservation of G+C content between human and mouse. Shown are G+C content in 50Kb segments of orthologous human and mouse genome segments. Spearman correlation is given on the plot. (C) Residual ToR is conserved. We computed the residual ToR (see Materials and Methods) for each of the experiments by subtracting the G+C to ToR trend (depicted in 2A) from the original ToR value. The residual profiles therefore lack any correlation to the regional G+C content. Shown are two-way comparisons among the residual profiles, demonstrating highly significant ToR correlation even after the G+C correlation has been normalized.
Figure 3
Figure 3. ToR and chromosomal interactions.
(A) Late replicating domains are less accessible. The number of inter chromosomal interactions involving each replication time group are shown. We show the for each replication group the number of trans interactions that include this group (we call this measure the accessibility of the group). The late replicating group takes part in less interactions. (B) Regions with similar ToR tend to trans-interact. We show for each pair of replication groups the interaction ratio (log scale), which is the number of trans interactions, normalized according to the accessibility of the group (shown in Figure 3A). There is a bias towards self interactions within the early and the late replicating groups. (C) Early replicating DNA is more involved in close cis interaction. We show for each ToR group the number of intra-chromosomal interactions, divided into close interactions (<500K) and far interactions (>500K).
Figure 4
Figure 4. ToR divergence at genome rearrangement sites.
(A) Phylogenetic tree. The phylogenetic tree used in our analysis, showing the number of simple fusion events on each branch. (B) Fusion event illustrated. Two syntenic blocks (colored green and orange) are adjacent in mouse and rat, and distal in human dog and rhesus. The branch associated with the event is marked in red on the phylo-tree. (C) Two possible divergence patterns following a fusion event. On top we show schematically the ancestral ToR of two distal segments (early replicating and late replicating domains) prior to fusion. After the fusion event the ToR can either propagate from the early domain into the late domain (early-to-late invasion), or from the late domain into the early domain (late-to-early invasion). (D) Invasion examples. We depict the mouse lymphoblast ToR with a black line (confidence intervals are shown in grey). The human ToR as projected onto the mouse genome is depicted with blue dots. The two segments that got fused are colored green (left segment) and orange (right segment). The approximated ToR near the breakpoint prior to fusion is depicted with a colored circle (green and orange) for both segments. Known genes are depicted with green rectangles below each graph. On top we show an example of the more common case of early-to-late invasion, while on bottom we show a late-to-early invasion (see Figure S12 for data on both cell types and more details). (E) ToR divergence at distal fusion sites. Shown is a scatter plot of the ToR divergence on the late side (segment that had later ToR prior to fusion, Y axis) versus the ToR divergence on the early side (segment that had earlier ToR prior to fusion, X axis). We draw the mean ToR divergence ± its standard deviation as vertical and horizontal grid lines (gray). We classify an event as an early-to-late invasion (E2L) if on the early side the divergence is close to the mean divergence (up to the standard deviation), and the late side divergence is greater than the sum of the mean divergence and its standard deviation (colored red). Similarly, we classify an event as an late-to-early (L2E) invasion if the late side the divergence is close to the mean divergence (up to the standard deviation), and the early side divergence is smaller than the mean divergence minus its standard deviation (colored blue). For fibroblasts we counted 15 E2L events versus 7 L2E events. For lymphoblasts we counted 23 E2L events versus 14 L2E events. In all cases we computed a hyper-geometric test versus 10,000 random points in the genome (plotted in gray) to verify that these counts are significantly diverged from the background (for L2E P value <10−5, for E2L P value <0.025).
Figure 5
Figure 5. ToR and Hi-C preferences of distal rearrangements.
(A) Distal fusion events involve early replicating domains. Each distal murine fusion event (inter-chromosomal or spanning at least 5MB in all non-rodent species) is associated with 2 human ToR groups (of the two segment ends that got fused). We show the breakdown of fusion events according to ToR groups. (B) Distal fusion events bring together domains with similar ToR. We split the genome to two equal groups (E:early, L:late), and counted for all murine distal fusions the number interaction of all possible pairs (E-E, E-L, L-L). We show the ratio between the counts and a random control (log10 scale), showing a significant preference for fusions of the same ToR group. (C) Distal fusion events are enriched for Hi-C interactions. We focused on murine distal fusion event that involves a pair of human sites that reside on different chromosomes. For each pair we counted the number of Hi-C interactions in the human genome (between segments of 1Mb centered on the breakpoint), which reflects chromosomal proximity. As a control we shuffled the pairs, getting random pairs of sites in the human genome that reside on different chromosomes. Using 75% as a threshold (dashed line), we tagged each pair as interacting (1st quartile) or non-interacting (other quartiles). Breakpoints are enriched in the interacting group (1.6 enrichment and P<0.01 in a Hyper geometric test). Shown are density plots of the number of reads between mouse fused pairs (red), between the shuffled control pairs (grey), and between a collection of random pairs selected over all of the genome (black).

References

    1. Pauler FM, Sloane MA, Huang R, Regha K, Koerner MV, et al. H3K27me3 forms BLOCs over silent genes and intergenic regions and specifies a histone banding pattern on a mouse autosomal chromosome. Genome Res. 2009;19:221–233. - PMC - PubMed
    1. Wen B, Wu H, Shinkai Y, Irizarry RA, Feinberg AP. Large histone H3 lysine 9 dimethylated chromatin blocks distinguish differentiated from embryonic stem cells. Nat Genet. 2009;41:246–250. - PMC - PubMed
    1. Mikkelsen TS, Ku M, Jaffe DB, Issac B, Lieberman E, et al. Genome-wide maps of chromatin state in pluripotent and lineage-committed cells. Nature. 2007;448:553–560. - PMC - PubMed
    1. Bernstein BE, Mikkelsen TS, Xie X, Kamal M, Huebert DJ, et al. A bivalent chromatin structure marks key developmental genes in embryonic stem cells. Cell. 2006;125:315–326. - PubMed
    1. Gilbert N, Boyle S, Fiegler H, Woodfine K, Carter NP, et al. Chromatin architecture of the human genome: gene-rich domains are enriched in open chromatin fibers. Cell. 2004;118:555–566. - PubMed

Publication types