. 2010 Jun 21:4:15.
doi: 10.3389/fncel.2010.00015. eCollection 2010.

Contribution of GABAergic interneurons to the development of spontaneous activity patterns in cultured neocortical networks

Affiliations

Contribution of GABAergic interneurons to the development of spontaneous activity patterns in cultured neocortical networks

Thomas Baltz et al. Front Cell Neurosci. .

Abstract

Periodic synchronized events are a hallmark feature of developing neuronal networks and are assumed to be crucial for the maturation of the neuronal circuitry. In the developing neocortex, the early network oscillations coincide with an excitatory action of the neurotransmitter gamma-aminobutyric acid (GABA). A relationship between the emerging inhibitory action of GABA and the gradual disappearance of early synchronized network activity has been previously suggested. Therefore we investigate the interplay between the action of GABA and spontaneous activity in cultured networks of the lateral or dorsal embryonic rat neocortex, which show considerable difference in the content of GABAergic neurons. Here we present the results of long-term monitoring of spontaneous electrical activity of cultured networks growing on microelectrode arrays and the time course of changes in GABA action using calcium imaging. All cultures studied displayed stereotyped synchronized burst events at the end of the first week in vitro. As the GABA(A) depolarizing action decreases, naturally or after bumetanide treatment, network activity in lateral cortex cultures changed from stereotypic bursting to more clustered and asynchronous activity patterns. Dorsal cortex cultures and cultures lacking GABA(A)-receptor mediated synaptic transmission, retained an immature synchronous firing pattern, but developed prominent intraburst oscillations ( approximately 3-10 Hz). Large, mostly parvalbumin positive, GABAergic neurons dominate the GABAergic population in lateral cortex cultures. These large interneurons were virtually absent in dorsal cortex cultures. Based on these results, we suggest that the richly interconnected large GABAergic neurons contribute to desynchronize and temporally differentiate the spontaneous activity of cultured cortical networks.

Keywords: MEA; cell culture; cerebral cortex; gamma-aminobutyric acid; neocortex; network activity; oscillations; rat.


Figures

Figure 1
Figure 1
Spontaneous network activity development of lateral cortex cultures (vCtx). (A) The total spike frequency is shown over time for the same culture at different stages of development (DIV, see labeling on the left side). vCtx cultures develop a heterogeneous pattern of burst discharges when maintained several weeks in vitro. The upper part of each graph indicates the global firing rate, which is defined as the number of detected spikes through all MEA electrodes per time unit (second). Spikes detected by individual electrodes are indicated by gray levels in the lower part. The same scale (see gray scale at 13 DIV) was used for all graphs. Each of the vertically stacked horizontal lines corresponds to one electrode. For clarity only 5 min out of the 20-min recording sessions are shown. Arrows indicate bursts which are shown in higher temporal resolution in (B). (B) Individual population bursts in higher time resolution. Lower case letters correspond to labeling in (A). Dotted lines indicate detected burst limits. Time unit for the global firing rate is 0.1 s. (C) Histograms of the interburst interval (top) and electrode attendance in bursts (bottom) for a 20-min recording session for the culture shown in (A) at 13 DIV. Note the log scale for the interburst interval histogram (bin size is 1 s). (D) Same as (C) except for 17 DIV. (E) Same as (C) except for 22 DIV.
Figure 2
Figure 2
Features of spontaneous activity of vCtx networks. (A) Extracellularly recorded signals show three burst events of different magnitude from a 21-day-old vCtx culture. Gray lines above each raw trace indicate the band-pass filtered signal (2–10 Hz). The same burst event is shown on three different electrodes 1–2 mm apart. (B) Same as in (A), except that the vCtx culture was chronically blocked with gabazine (20 μM, added at 0 DIV).
Figure 3
Figure 3
Acute GABAAR blockade of 3-week-old networks. (A) Bursting activity of a 21-day-old vCtx culture under control conditions (left) and during the presence of the GABAAR blocker bicuculline (5 μM) in the culture media (right). (B) Same as in (A) but for dCtx networks (see Figures 9–11). (C–G) Dark gray bars in summary graphs show changes of burst properties of vCtx cultures in blocked compared with control conditions. Light gray bars show equivalent quantitative results for acutely blocked dCtx compared with control dCtx networks. Data were obtained from 20-min recording sessions of 20- to 28-day-old cultures (vCtx cultures: n = 8, dCtx cultures: n = 7, three preparations, asterisks indicate significance: *p < 0.05; **p < 0.001; ***p < 0.0001; t-test).
Figure 4
Figure 4
Developmental change of the GABAAR mediated calcium response in vCtx cultures. (A) Schematic drawing indicates the local drug application pipette over the differential interference contrast image of a 5-day-old culture (Scale bar = 20 μm). (B) Fluorescence changes of an individual cell [white circle in (A)] in response to a short pulse of either a solution containing high potassium (60 mM) or the GABAAR agonist muscimol (200 μM). The three calcium transients correspond to the time points of drug application, indicated by bars at the bottom. The black dots denote the maximum fluorescence in response to the K+ pulses (FK1 and FK2). The gray dot denotes the maximum fluorescence in response to local muscimol application (FM). (C) Fluo-3 fluorescence of the cells shown in (A) at FK1, FM and FK2. (D) Average ratio of the evoked calcium responses FM and FK1 at DIV 5, DIV 13 and DIV 29 (n = 1834, 1922 and 1643 cells, respectively; each from three independent preparations; asterisks indicate significance, p < 0.0001; t-test). (E) The fraction of cells with a significant increase of fluorescence in response to muscimol in each recorded field is shown as a function of time. Each dot represents the average of several recorded fields (>15), pooled from three cultures per DIV, three preparations. Solid line is a Boltzmann fitted sigmoid. (F) Example traces of muscimol elicited calcium transients for different ages for the time interval indicated by a dotted line in (B). (G) Histograms of the ratio FM and FK1 at the indicated days in vitro.
Figure 5
Figure 5
Blockade of NKCC1 function by bumetanide. (A,B) The total network spike frequency over time is shown for a 9-day-old vCtx culture in control conditions (A) and in the presence of bumetanide (10 μM) in the culture media (B). (C,D) Histograms of the electrode attendance during bursts (C) and interburst interval (D) for a 20-min recording period, of which 600 s are shown in (A). Note the log scale for the interburst interval histogram (bin size is 1 s). (E,F) Same as (C,D) except for the recording shown in (B). (G,H) Bumetanide induced changes in the variability of the interburst interval (G) and intraburst frequency (H). Asterisks indicate statistical significance: *p < 0.05, n = 7, two preparations, t-test).
Figure 6
Figure 6
GABAergic neurons in 3-week-old cultured networks. (A) The bright field image shows several large GABA immunostained neurons in a 21-day-old vCtx culture (DAB staining). The arrowhead indicates a small GABAergic neuron. (B) Same as (A) except for dCtx culture. Two small GABAergic neurons can clearly be identified. (C1–3) Colocalization of gamma-aminobutyric acid (GABA) and parvalbumin (PV) immunofluorescence in a large GABAergic neuron (arrow) in a 21-day-old vCtx culture. The arrowhead indicates a small GABA+/PV− neuron. Scale bar is 20 μm. (D) Distribution of the soma size of GABAergic neurons in vCtx cultures (see main text for details). (E) Same as (D) except for dCtx cultures.
Figure 7
Figure 7
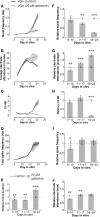
Spontaneous activity development of vCtx networks with chronically blocked GABAA receptors. (A) The total spike frequency is shown over time for vCtx cultures chronically treated with gabazine (20 μM, added at 0 DIV) at different stages of development (13, 17, 22 DIV). These networks develop a regular bursting pattern, which persists throughout their lifetime. See Figure 1 for graph description. Arrows indicate bursts which are shown in higher temporal resolution in (B). (B) Individual population bursts in higher time resolution. Oscillatory discharges emerge during the third week in vitro. Lower case letters correspond to labeling in (A). Dotted lines indicate detected burst limits. Time unit for the global firing rate is 0.1 s. (C) Histograms of the interburst interval (top) and electrode attendance in bursts (bottom) for a 20-min recording session for the culture shown in (A) at 13 DIV. Note the log scale for the interburst interval histogram (bin size is 1 s). (D) Same as (C) except for 17 DIV. (E) Same as (C) except for 22 DIV.
Figure 8
Figure 8
Quantitative features of spontaneous activity development: GABAAR-blocked compared with control vCtx networks. (A–D) Graphs show the development of spontaneous network activity features in control vCtx cultures and in sister vCtx cultures grown with GABAAR blocker gabazine (20 μM) added to the medium. (A) Shows the development of the burst frequency, (B) the average number of spiking electrodes during a burst event, (C) the coefficient of variation of the interburst interval (CV IBI) and (D) the total spike frequency for cultures obtained from one preparation. (A–D, n = 4, cultures per age group, shaded areas in this and subsequent figures indicate SEM). (E–J) Summary graphs of parameters of spontaneous activity development of blocked vCtx cultures pooled from different preparations normalized to values of age-matched control cultures in each preparation. Data were obtained from 20-min recording sessions per day in vitro. Asterisks indicate significance: *p < 0.05; **p < 0.001; ***p < 0.0001; t-test; 5–10 DIV n = 28 recordings of unblocked cultures/n = 27 recordings of blocked cultures; 11–17 DIV n = 33/n = 30; 18–24 DIV n = 20/n = 18; eight cultures per group; three preparations. Data are given in mean ± SEM.
Figure 9
Figure 9
Spontaneous network activity development of dorsal cortex (dCtx) cultures. (A) The total spike frequency is shown over time for the same culture at different stages of development (DIV, see labeling on the left side). dCtx cultures develop a regular bursting pattern, which persists throughout their lifetime. See Figure 1 for graph description. Arrows indicate bursts which are shown in higher temporal resolution in (B). (B) Individual population bursts in higher time resolution. Oscillatory discharges emerge approximately during the third week in vitro. Lower case letters correspond to labeling in (A). Dotted lines indicate detected burst limits. Time unit for the global firing rate is 0.1 s. (C) Histograms of the interburst interval (top) and electrode attendance in bursts (bottom) for a 20-min recording session for the culture shown in (A) at 13 DIV. Note the log scale for the interburst interval histogram (bin size is 1 s). (D) Same as (C) except for 17 DIV. (E) Same as (C) except for 22 DIV.
Figure 10
Figure 10
Features of dCtx spontaneous network activity. Extracellularly recorded signals from three burst events of a recording from a dCtx culture (21 DIV). Gray lines above each raw trace indicate the band-pass filtered signal (2–10 Hz). The same burst event is shown on three different electrodes.
Figure 11
Figure 11
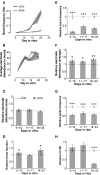
Quantitative features of spontaneous activity development: dCtx compared with vCtx networks. (A,B) Graphs show the development of spontaneous network activity features in control vCtx and in sister dCtx cultures from one preparation (n = 3 cultures per culture type). (A) shows the development of the burst frequency and (B) the electrode number in burst events as a function of time. (C–H) Summary graphs of parameters of spontaneous activity development of dCtx cultures pooled from different preparations normalized to values of age-matched vCtx sister cultures in each preparation. Data are obtained from 20-min recording sessions per day in vitro. Asterisks indicate significance: *p < 0.05; **p < 0.001; ***p < 0.0001; t-test; 5–10 DIV n = 36 recordings of vCtx cultures/n = 31 recordings of dCtx cultures; 11–17 DIV n = 56/n = 59; 18–24 DIV n = 44/n = 47; 12 cultures per group; five preparations.
Figure 12
Figure 12
Developmental change of the GABAAR mediated calcium response in dCtx cultures. (A) Graph shows the fraction of neurons in dCtx cultures with a significant increase of fluorescence in response to muscimol, as a function of time. Each dot represents the average of several recorded fields (>15), pooled from three cultures from three preparations per time point. Solid line is a Boltzmann fitted sigmoid (see also Figure 4 for a more detailed description of the experimental configuration). (B) Histograms of the ratio FM and FK1 at the indicated days in vitro. (C) Example traces of muscimol elicited calcium fluorescence at the indicated ages. (D) Average ratio of the evoked calcium responses FM and FK1 at DIV 5, DIV 13 and DIV 29 (n = 1297, 2142 and 1613 cells, respectively; each from three independent preparations; asterisks indicate significance, p < 0.0001; t-test).

References

    1. Allene C., Cattani A., Ackman J. B., Bonifazi P., Aniksztejn L., Ben-Ari Y., Cossart R. (2008). Sequential generation of two distinct synapse-driven network patterns in developing neocortex. J. Neurosci. 28, 12851–1286310.1523/JNEUROSCI.3733-08.2008 - DOI - PMC - PubMed
    1. Angenstein F., Niessen H. G., Goldschmidt J., Vielhaber S., Ludolph A. C., Scheich H. (2004). Age-dependent changes in MRI of motor brain stem nuclei in a mouse model of ALS. Neuroreport 15, 2271–227410.1097/00001756-200410050-00026 - DOI - PubMed
    1. Baker R. E., Corner M. A., van Pelt J. (2006). Spontaneous neuronal discharge patterns in developing organotypic mega-co-cultures of neonatal rat cerebral cortex. Brain Res. 1101, 29–3510.1016/j.brainres.2006.05.028 - DOI - PubMed
    1. Bakkum D. J., Chao Z. C., Potter S. M. (2008). Spatio-temporal electrical stimuli shape behavior of an embodied cortical network in a goal-directed learning task. J. Neural Eng. 5, 310–32310.1088/1741-2560/5/3/004 - DOI - PMC - PubMed
    1. Balena T., Woodin M. A. (2008). Coincident pre- and postsynaptic activity downregulates NKCC1 to hyperpolarize E(Cl) during development. Eur. J. Neurosci. 27, 2402–241210.1111/j.1460-9568.2008.06194.x - DOI - PubMed