. 2010 May 14:4:12.
doi: 10.3389/fncir.2010.00012. eCollection 2010.

Quantitative classification of somatostatin-positive neocortical interneurons identifies three interneuron subtypes

Affiliations

Quantitative classification of somatostatin-positive neocortical interneurons identifies three interneuron subtypes

Laura M McGarry et al. Front Neural Circuits. .

Abstract

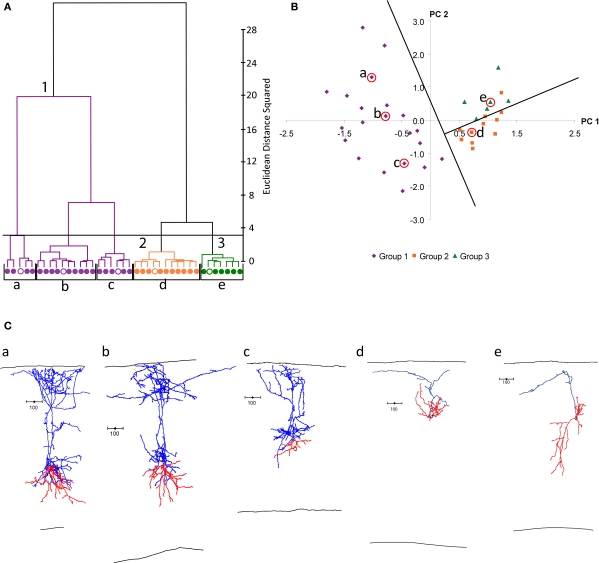
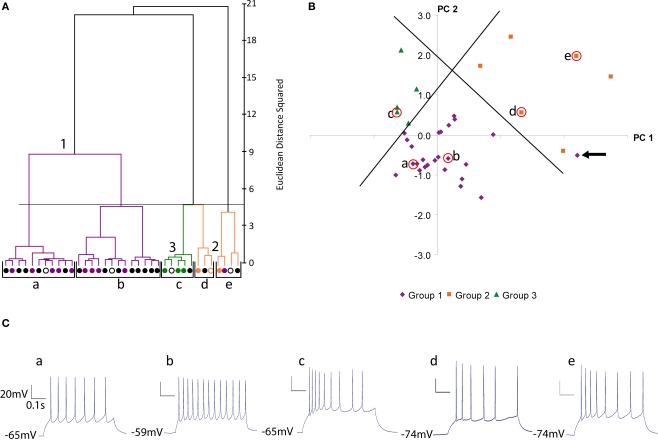
Deciphering the circuitry of the neocortex requires knowledge of its components, making a systematic classification of neocortical neurons necessary. GABAergic interneurons contribute most of the morphological, electrophysiological and molecular diversity of the cortex, yet interneuron subtypes are still not well defined. To quantitatively identify classes of interneurons, 59 GFP-positive interneurons from a somatostatin-positive mouse line were characterized by whole-cell recordings and anatomical reconstructions. For each neuron, we measured a series of physiological and morphological variables and analyzed these data using unsupervised classification methods. PCA and cluster analysis of morphological variables revealed three groups of cells: one comprised of Martinotti cells, and two other groups of interneurons with short asymmetric axons targeting layers 2/3 and bending medially. PCA and cluster analysis of electrophysiological variables also revealed the existence of these three groups of neurons, particularly with respect to action potential time course. These different morphological and electrophysiological characteristics could make each of these three interneuron subtypes particularly suited for a different function within the cortical circuit.

Keywords: GABA; Martinotti; PCA; cluster; neurolucida.


Figures

Figure 1
Figure 1
Anatomical classification of SOM neurons. (A) Ward's method of hierarchical unsupervised clustering based on 67 morphological variables applied to 39 SOM positive interneurons. The first 2 principal components were retained for cluster analysis. The x-axis of dendrogram shows individual cells and the y-axis represents the linkage distance measured by the Euclidean distance squared. Open circles indicate the centroid cell of each cluster. Black brackets outline the clusters statistically significant at the 5% level and a horizontal line indicates this cut-off linkage distance. The groups discussed in the text are colored: group 1 in purple, group 2 in orange and group 3 in green. (B) Scatterplot of dataset in principal component space. The x-axis represents the first principal component (PC1) and the y-axis represents the second principal component (PC2). Centroids of clusters are labeled and circled in red. Orthogonal lines separating the three groups are shown. (C) Neurolucida reconstructions of representative cells of each cluster. Axons are shown in blue and dendrites in red.
Figure 2
Figure 2
Physiological classification of SOM neurons. (A) Ward's method of hierarchical unsupervised clustering based on 19 electrophysiological variables applied to 36 SOM positive interneurons. The first 2 principal components were retained for cluster analysis. The x-axis of dendrogram shows individual cells and the y-axis represents the linkage distance measured by Euclidean distance squared. Open circles indicate the centroid cell of each cluster. Black brackets outline the clusters statistically significant at the 5% level and a horizontal line indicates this cut-off linkage distance. Group 1 (Martinotti cells) are shown in purple, group 2 in orange and group 3 in green. This color scheme is based on the clustering by morphological variables (See Figure 1) and will be preserved for all figures. Black cells are those without morphological reconstruction. (B) Scatterplot of dataset in principal component space. The x-axis represents the first principal component (PC1) and the y-axis represents the second principal component. Centroids of clusters are labeled and circled in red. Orthogonal lines separating the three groups are shown. The outlier in cluster e is indicated with an arrow. (PC2). (C) Current clamp recording of response to twice threshold current pulse for the centroid cells of each cluster.
Figure 3
Figure 3
Silhouette analysis. (A) Plot of silhouette values for clustering of 39 cells by morphological variables (see Figure 1A for dendrogram of this dataset). On the y-axis cells in each cluster are ordered by decreasing silhouette value. The silhouette value can range between −1 and 1. Large positive values indicate clusters are distinct with greater intra-cluster similarity than between cluster similarity (See Materials and Methods for further explanation). The x-axis represents the silhouette value (See Materials and Methods). (B) Plot of silhouette values for clustering of 36 cells by electrophysiolgical variables (see Figure 2A for dendrogram of this dataset). (C–E) Plot of silhouette values (left) and dendrogram (right) for clustering of the 16 cells with both recordings and reconstructions by morphological variables (C), by electrophysiological variables (D) and by electrophysiological and morphological variables (E). The first 2 principal components were retained for cluster analysis by the morphology variables (C) and electrophysiological variables (D). The first 3 principal components were retained for cluster analysis by both the electrophysiology and morphology variables (E). Again the color scheme is based on the clustering by morphology (see Figure 1).
Figure 4
Figure 4
Axonal features of group 2 and 3 cells. (A) Axons of group 2 and 3 cells avoid layer 1. The 9 cells with axons that turn or hook are shown, all oriented with respect to the medial-lateral axis above. Note the preference of direction medially. (B) Light microscope images of section of two cells’ axons in the area boxed in the reconstructions below. Swellings in the axon indicated by arrow heads are possible boutons, found along the axons in layer 2/3.
Figure 5
Figure 5
Analysis of electrophysiology variables. Comparison of physiological variables that distinguish the three groups with regards to several variables. All data shown mean ± standard error (A) Groups 2 and 3 are distinct from group 1 with respect to RMP, input resistance, AP amplitude and difference in amplitude between first and second AP of a train. (B) Each group has a distinct time course of AP, with group 1 intermediate between groups 2 and 3. (*p ≤ 0.05, **p ≤ 0.025, ***p ≤ 0.005, Mann Whitney U Test)

References

    1. Ali A. B., Bannister P., Thomson A. (2007). Robust Correlations between action potential duration and the properties of synaptic connections in layer 4 interneurons in neocortical slices from juvenile rats and adult rat and cat. J. Physiol. (Lond.) 5801, 149–16910.1113/jphysiol.2006.124214 - DOI - PMC - PubMed
    1. Ascoli G. A., Alonso-Nanclares L., Anderson S. A., Barrionuevo G., Benavides-Piccione R., Burkhalter A., Buzsáki G., Cauli B., Defelipe J., Fairén A., Feldmeyer D., Fishell G., Fregnac Y., Freund T. F., Gardner D., Gardner E. P., Goldberg J. H., Helmstaedter M., Hestrin S., Karube F., Kisyárday Z. F., Lambolez B., Lewis D. A., Marin O., Markaram H., Muñoz A., Packer A., Petersen C. C., Rockland K. S., Rossier J., Bernardo R., Somogyi P., Staiger J. F., Tamas G., Thomson A. M., Toledo-Rodriguez M., Wang Y., West D. C., Yuste R. (2008). Petilla terminology: nomenclature of features of GABAergic interneurons of the cerebral cortex. Nat. Rev. Neurosci. 9, 557–56810.1038/nrn2402 - DOI - PMC - PubMed
    1. Cattell R. B. (1966). The scree test for the number of factors. Multivariate Behav. Res. 1, 245–27610.1207/s15327906mbr0102_10 - DOI - PubMed
    1. Cauli B., Porter J. T., Tsuzuki K., Lambolez B., Rossier J., Quenet B., Audinat E. (2000). Classification of fusiform neocortical interneurons based on unsupervised clustering. Proc. Natl. Acad. Sci. U.S.A. 97, 6144–614910.1073/pnas.97.11.6144 - DOI - PMC - PubMed
    1. Cauli B., Audinat E., Lambolez B., Angulo M. C., Ropert N., Tsuzuki K., Hestrin S., Rossier J. (1997). Molecular and physiological diversity of cortical nonpyramidal cells. J. Neurosci. 17, 3894–390610.1111/j.1460-9568.1994.tb00572.x - DOI - PMC - PubMed

LinkOut - more resources