

A proteomic and transcriptional view of acidogenic and solventogenic steady-state cells of Clostridium acetobutylicum in a chemostat culture
- PMID: 20617312
- PMCID: PMC3227527
- DOI: 10.1007/s00253-010-2741-x
A proteomic and transcriptional view of acidogenic and solventogenic steady-state cells of Clostridium acetobutylicum in a chemostat culture
Abstract
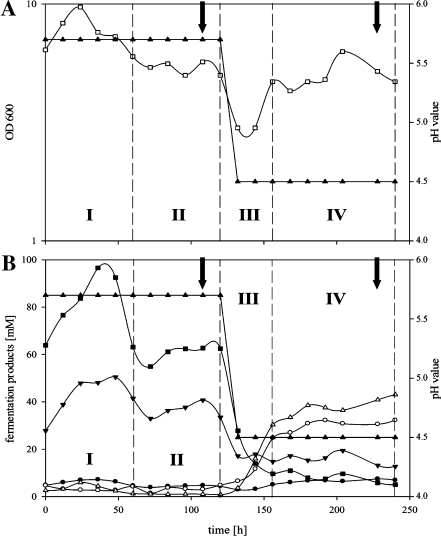
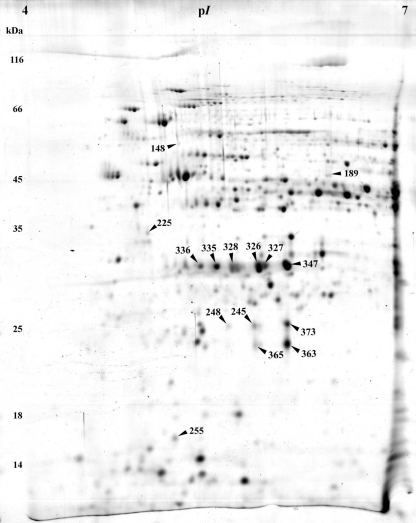
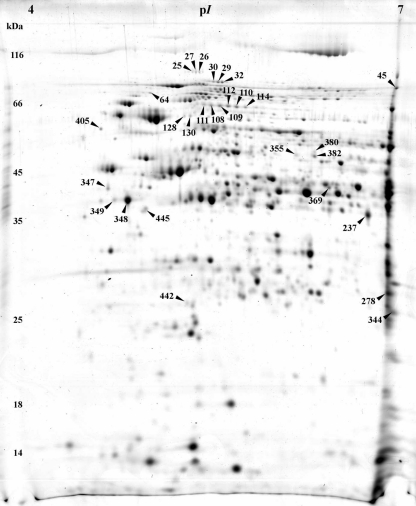
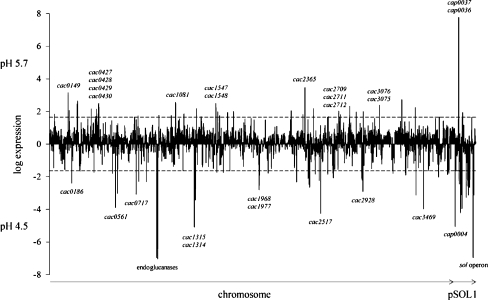
The complex changes in the life cycle of Clostridium acetobutylicum, a promising biofuel producer, are not well understood. During exponential growth, sugars are fermented to acetate and butyrate, and in the transition phase, the metabolism switches to the production of the solvents acetone and butanol accompanied by the initiation of endospore formation. Using phosphate-limited chemostat cultures at pH 5.7, C. acetobutylicum was kept at a steady state of acidogenic metabolism, whereas at pH 4.5, the cells showed stable solvent production without sporulation. Novel proteome reference maps of cytosolic proteins from both acidogenesis and solventogenesis with a high degree of reproducibility were generated. Yielding a 21% coverage, 15 protein spots were specifically assigned to the acidogenic phase, and 29 protein spots exhibited a significantly higher abundance in the solventogenic phase. Besides well-known metabolic proteins, unexpected proteins were also identified. Among these, the two proteins CAP0036 and CAP0037 of unknown function were found as major striking indicator proteins in acidogenic cells. Proteome data were confirmed by genome-wide DNA microarray analyses of the identical cultures. Thus, a first systematic study of acidogenic and solventogenic chemostat cultures is presented, and similarities as well as differences to previous studies of batch cultures are discussed.
Figures
Similar articles
-
Metabolome remodeling during the acidogenic-solventogenic transition in Clostridium acetobutylicum.Appl Environ Microbiol. 2011 Nov;77(22):7984-97. doi: 10.1128/AEM.05374-11. Epub 2011 Sep 23. Appl Environ Microbiol. 2011. PMID: 21948824 Free PMC article.
-
Expression of abrB310 and SinR, and effects of decreased abrB310 expression on the transition from acidogenesis to solventogenesis, in Clostridium acetobutylicum ATCC 824.Appl Environ Microbiol. 2005 Apr;71(4):1987-95. doi: 10.1128/AEM.71.4.1987-1995.2005. Appl Environ Microbiol. 2005. PMID: 15812030 Free PMC article.
-
Proteome reference map and comparative proteomic analysis between a wild type Clostridium acetobutylicum DSM 1731 and its mutant with enhanced butanol tolerance and butanol yield.J Proteome Res. 2010 Jun 4;9(6):3046-61. doi: 10.1021/pr9012078. J Proteome Res. 2010. PMID: 20426490
-
Transcriptional regulation of solventogenesis in Clostridium acetobutylicum.J Mol Microbiol Biotechnol. 2002 May;4(3):295-300. J Mol Microbiol Biotechnol. 2002. PMID: 11931561 Review.
-
Recent advances in n-butanol and butyrate production using engineered Clostridium tyrobutyricum.World J Microbiol Biotechnol. 2020 Aug 14;36(9):138. doi: 10.1007/s11274-020-02914-2. World J Microbiol Biotechnol. 2020. PMID: 32794091 Review.
Cited by
-
Bioconversion of Lignocellulosic Biomass into Value Added Products under Anaerobic Conditions: Insight into Proteomic Studies.Int J Mol Sci. 2021 Nov 12;22(22):12249. doi: 10.3390/ijms222212249. Int J Mol Sci. 2021. PMID: 34830131 Free PMC article. Review.
-
Transcriptional analysis of micronutrient zinc-associated response for enhanced carbohydrate utilization and earlier solventogenesis in Clostridium acetobutylicum.Sci Rep. 2015 Nov 20;5:16598. doi: 10.1038/srep16598. Sci Rep. 2015. PMID: 26586044 Free PMC article.
-
Cap0037, a Novel Global Regulator of Clostridium acetobutylicum Metabolism.mBio. 2016 Oct 4;7(5):e01218-16. doi: 10.1128/mBio.01218-16. mBio. 2016. PMID: 27703070 Free PMC article.
-
Complex and extensive post-transcriptional regulation revealed by integrative proteomic and transcriptomic analysis of metabolite stress response in Clostridium acetobutylicum.Biotechnol Biofuels. 2015 Jun 10;8:81. doi: 10.1186/s13068-015-0260-9. eCollection 2015. Biotechnol Biofuels. 2015. PMID: 26269711 Free PMC article.
-
Metabolome remodeling during the acidogenic-solventogenic transition in Clostridium acetobutylicum.Appl Environ Microbiol. 2011 Nov;77(22):7984-97. doi: 10.1128/AEM.05374-11. Epub 2011 Sep 23. Appl Environ Microbiol. 2011. PMID: 21948824 Free PMC article.
References
-
- Bahl H, Andersch W, Braun K, Gottschalk G. Effect of pH and butyrate concentration on the production of acetone and butanol by Clostridium acetobutylicum grown in continuous culture. Eur J Appl Microbiol Biotechnol. 1982;14:17–20. doi: 10.1007/BF00507998. - DOI
-
- Bahl H, Andersch W, Gottschalk G. Continuous production of acetone and butanol by Clostridium acetobutylicum in a two-stage phosphate limited chemostat. Eur J Appl Microbiol Biotechnol. 1982;15:201–205. doi: 10.1007/BF00499955. - DOI
Publication types
MeSH terms
Substances
LinkOut - more resources
Full Text Sources
Other Literature Sources
Molecular Biology Databases
