Microfluidic system for generation of sinusoidal glucose waveforms for entrainment of islets of Langerhans
- PMID: 20617825
- PMCID: PMC2921651
- DOI: 10.1021/ac101461x
Microfluidic system for generation of sinusoidal glucose waveforms for entrainment of islets of Langerhans
Abstract
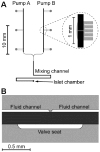
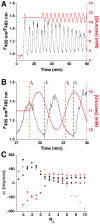
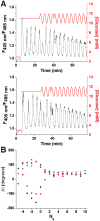
A microfluidic system was developed to produce sinusoidal waveforms of glucose to entrain oscillations of intracellular [Ca(2+)] in islets of Langerhans. The work described is an improvement to a previously reported device where two pneumatic pumps delivered pulses of glucose and buffer to a mixing channel. The mixing channel acted as a low pass filter to attenuate these pulses to produce the desired final concentration. Improvements to the current device included increasing the average pumping frequency from 0.83 to 3.33 Hz by modifying the on-chip valves to minimize adhesion between the PDMS and glass within the valve. The cutoff frequency of the device was increased from 0.026 to 0.061 Hz for sinusoidal fluorescein waves by shortening the length of the mixing channel to 3.3 cm. The value of the cutoff frequency was chosen between the average pumping frequency and the low frequency (approximately 0.0056 Hz) glucose waves that were needed to entrain the islets of Langerhans. In this way, the pulses from the pumps were attenuated greatly but the low-frequency glucose waves were not. With the use of this microfluidic system, a total flow rate of 1.5 +/- 0.1 microL min(-1) was generated and used to deliver sinusoidal waves of glucose concentration with a median value of 11 mM and amplitude of 1 mM to a chamber that contained an islet of Langerhans loaded with the Ca(2+)-sensitive fluorophore, indo-1. Entrainment of the islets was demonstrated by pacing the rhythm of intracellular [Ca(2+)] oscillations to oscillatory glucose levels produced by the device. The system should be applicable to a wide range of cell types to aid understanding cellular responses to dynamically changing stimuli.
Figures


 ), 20 μM (blue circle,
  ), and 10 μM (green square,
  ) were applied with periods of 0.009 Hz, 0.018 Hz, 0.030 Hz, 0.045 Hz, 0.060 Hz and the attenuation of the output waveforms were determined as described in the text. The dashed line was found from Equation 1 using fC = 0.061 Hz.
 ) where Δθ did not stabilize and varied throughout the experiment.
Similar articles
-
Microfluidic perfusion system for automated delivery of temporal gradients to islets of Langerhans.Anal Chem. 2009 Feb 1;81(3):1162-8. doi: 10.1021/ac802579z. Anal Chem. 2009. PMID: 19178342 Free PMC article.
-
Microfluidic multi-analyte gradient generator.Anal Bioanal Chem. 2010 Nov;398(5):1985-91. doi: 10.1007/s00216-010-4168-8. Epub 2010 Sep 11. Anal Bioanal Chem. 2010. PMID: 20835814 Free PMC article.
-
Integrated perfusion and separation systems for entrainment of insulin secretion from islets of Langerhans.Lab Chip. 2015 Feb 7;15(3):823-32. doi: 10.1039/c4lc01360c. Lab Chip. 2015. PMID: 25474044 Free PMC article.
-
Application of microfluidic technology to pancreatic islet research: first decade of endeavor.Bioanalysis. 2010 Oct;2(10):1729-44. doi: 10.4155/bio.10.131. Bioanalysis. 2010. PMID: 21083325 Review.
-
Cytoplasmic Ca2+ oscillations in pancreatic beta-cells.Biochim Biophys Acta. 1992 Dec 11;1113(3-4):295-305. doi: 10.1016/0304-4157(92)90003-s. Biochim Biophys Acta. 1992. PMID: 1450203 Review.
Cited by
-
Measurement of the entrainment window of islets of Langerhans by microfluidic delivery of a chirped glucose waveform.Integr Biol (Camb). 2015 Sep;7(9):1061-7. doi: 10.1039/c5ib00156k. Epub 2015 Jul 27. Integr Biol (Camb). 2015. PMID: 26211670 Free PMC article.
-
Pancreatic islet organoids-on-a-chip: how far have we gone?J Nanobiotechnology. 2022 Jun 28;20(1):308. doi: 10.1186/s12951-022-01518-2. J Nanobiotechnology. 2022. PMID: 35764957 Free PMC article. Review.
-
Online fluorescence anisotropy immunoassay for monitoring insulin secretion from islets of Langerhans.Anal Methods. 2017 Jan 7;9(1):38-45. doi: 10.1039/C6AY02899C. Epub 2016 Oct 28. Anal Methods. 2017. PMID: 28458724 Free PMC article.
-
A Y-Shaped Microfluidic Device to Study the Combined Effect of Wall Shear Stress and ATP Signals on Intracellular Calcium Dynamics in Vascular Endothelial Cells.Micromachines (Basel). 2016 Nov 23;7(11):213. doi: 10.3390/mi7110213. Micromachines (Basel). 2016. PMID: 30404384 Free PMC article.
-
Visualizing hypoxic modulation of beta cell secretions via a sensor augmented oxygen gradient.Microsyst Nanoeng. 2023 Feb 7;9:14. doi: 10.1038/s41378-022-00482-z. eCollection 2023. Microsyst Nanoeng. 2023. PMID: 36760229 Free PMC article.
References
-
- Weigle DS. Diabetes. 1987;36:764–775. - PubMed
-
- Matthews DR, Naylor BA, Jones RG, Ward GM, Turner RC. Diabetes. 1983;32:617–621. - PubMed
-
- Bratusch-Marrain PR, Komjati M, Waldhausl WK. Diabetes. 1986;35:922–926. - PubMed
-
- Komjati M, Bratusch-Marrain P, Waldhausl W. Endocrinology. 1986;118:312–319. - PubMed
-
- Paolisso G, Scheen AJ, Giugliano D, Sgambato S, Albert A, Varricchio M, D'Onofrio F, Lefebvre PJ. J Clin Endocrinol Metab. 1991;72:607–615. - PubMed
Publication types
MeSH terms
Substances
Grants and funding
LinkOut - more resources
Full Text Sources
Other Literature Sources
Research Materials
Miscellaneous

