Sweat rates, sweat sodium concentrations, and sodium losses in 3 groups of professional football players
- PMID: 20617911
- PMCID: PMC2902030
- DOI: 10.4085/1062-6050-45.4.364
Sweat rates, sweat sodium concentrations, and sodium losses in 3 groups of professional football players
Abstract
Context: Sweat sodium losses have never been reported in a large cohort of American football players.
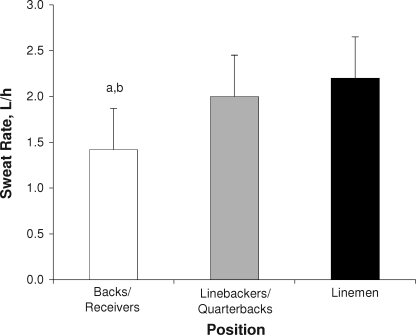
Objective: To compare sweat rates (SwtRs), sweat sodium concentrations (SwtNa(+)), and sodium losses in 3 groups of players (backs and receivers [BK], linebackers and quarterbacks [LB/QB], and linemen [LM]) to determine if positional differences and, therefore, size differences exist.
Design: Observational study.
Setting: Data were collected during practices in the second week of 2 consecutive training camps. The wet bulb globe temperature was 78.5 degrees F +/- 3.5 degrees F (25.9 degrees C +/- 1.9 degrees C).
Patients or other participants: Eighteen BK, 12 LB/QB, and 14 LM volunteered.
Intervention(s): Sterile sweat patches were applied to the right forearm after the skin was appropriately cleaned. The patches were removed during practice, placed in sterile tubes, centrifuged, frozen, and later analyzed by flame photometry.
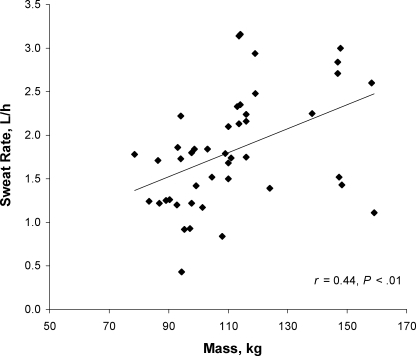
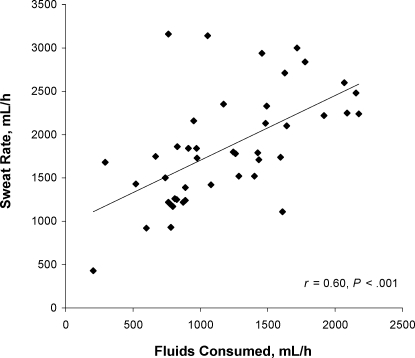
Main outcome measure(s): Sweat rate, SwtNa(+), and sodium loss. We calculated SwtR by change in mass adjusted for urine produced and fluids consumed divided by practice time in hours.
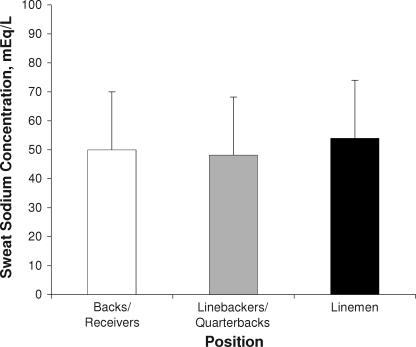
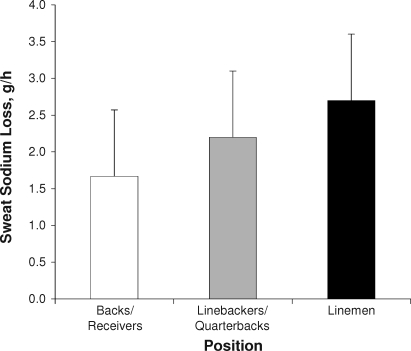
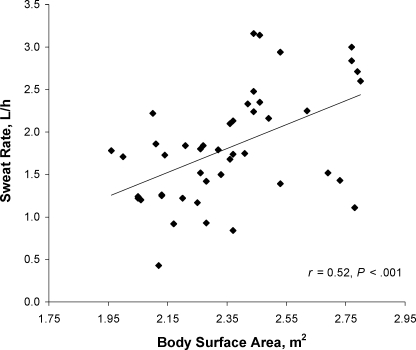
Results: Other than age, physical characteristics were different among groups (P < .001). The SwtR was different among groups (F(2,41) = 7.3, P = .002). It was lower in BK (1.42 +/- 0.45 L/h) than in LB/QB (1.98 +/- 0.49 L/h) (P < .05) and LM (2.16 +/- 0.75 L/h) (P < .01), but we found no differences between SwtRs for LB/QB and LM. The SwtNa(+) was not different among groups (BK = 50 +/- 16 mEq/L, LB/QB = 48.2 +/- 23 mEq/L, and LM = 52.8 +/- 25 mEq/L) and ranged from 15 to 99 mEq/L. Sweat sodium losses ranged from 642 mg/h to 6.7 g/h, and findings for group comparisons approached significance (P = .06). On days when players practiced 4.5 hours, calculated sodium losses ranged from 2.3 to 30 g/d.
Conclusions: The BK sweated at lower rates than did the midsized LB/QB and large LM, but LB/QB sweated similarly to LM. Sweat sodium concentration and daily sodium losses ranged considerably. Heavy, salty sweaters require increased dietary consumption of sodium during preseason.
Figures
References
-
- Fowkes Godek S., Bartolozzi A. R., Kelly M. Changes in blood electrolytes and plasma volume in National Football League players during preseason training camp. Athl Train Sports Health Care. 2009;1(6):259–266.
-
- Fowkes Godek S., Godek J. J., Bartolozzi A. R. Hydration status in college football players during consecutive days of twice-a-day preseason practices. Am J Sports Med. 2005;33(6):843–851. - PubMed
Publication types
MeSH terms
Substances
LinkOut - more resources
Full Text Sources
Other Literature Sources
Medical
Miscellaneous