. 2010 Jun;40(6):641-53.
doi: 10.1111/j.1872-034X.2010.00663.x.

Characteristics of hepatocellular carcinoma in a murine model of alpha-1-antitrypsin deficiency

Affiliations

Characteristics of hepatocellular carcinoma in a murine model of alpha-1-antitrypsin deficiency

Nancy Y Marcus et al. Hepatol Res. 2010 Jun.

Abstract

Aim: Individuals with homozygous (ZZ) alpha-1-antitrypsin (alpha1AT) deficiency are at an increased risk for liver damage, cirrhosis and hepatocellular carcinoma (HCC). The transgenic PiZ mouse, expressing the human alpha1AT mutant Z gene, is a valuable model for this disease. We studied PiZ mice in order to identify and characterize mechanisms involved in the development of HCC.

Methods: Tumor incidence and histology were studied, gene expression levels were surveyed with microarrays, RNA quantified with quantitative real time polymerase chain reaction and protein levels determined with immunoblots and immunohistochemistry.

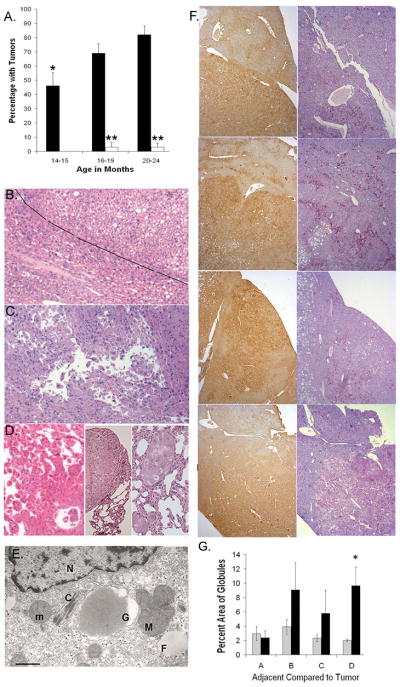
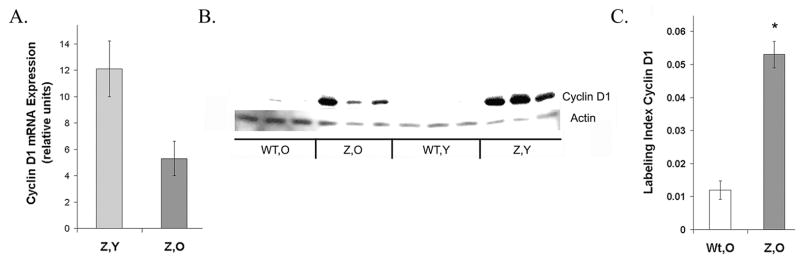
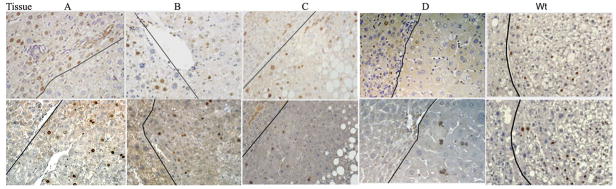
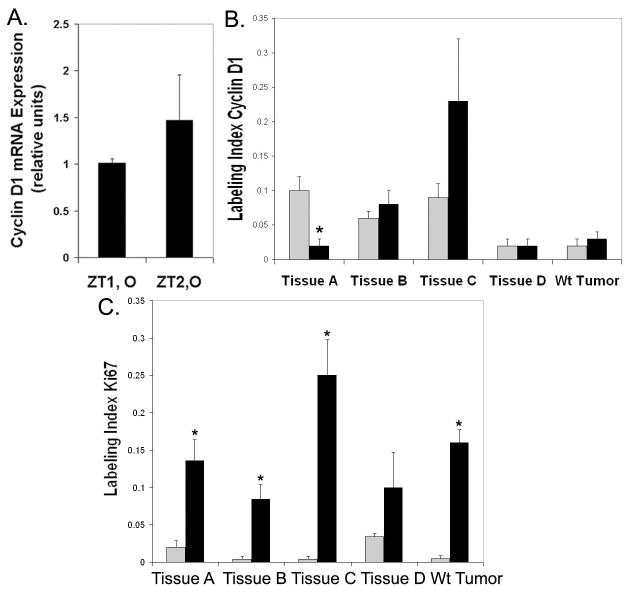
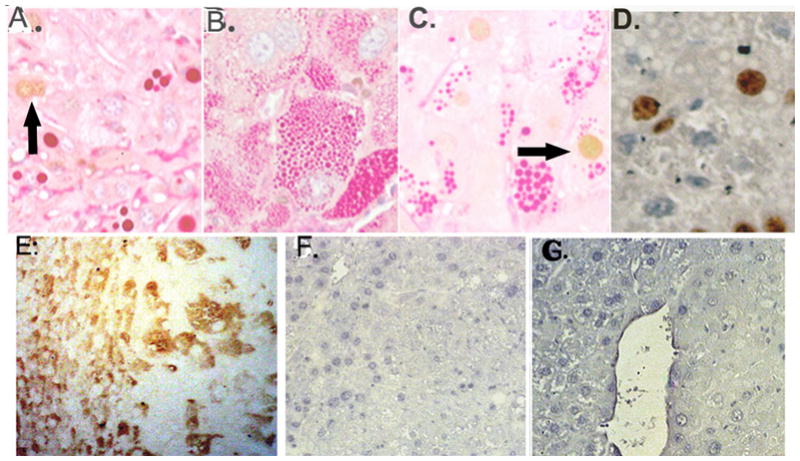
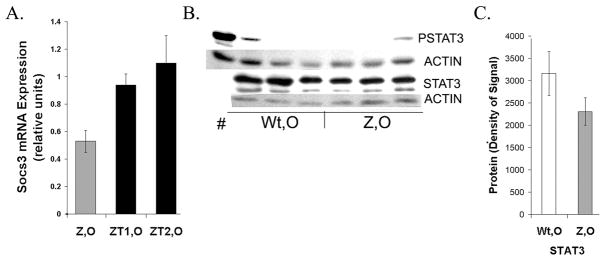
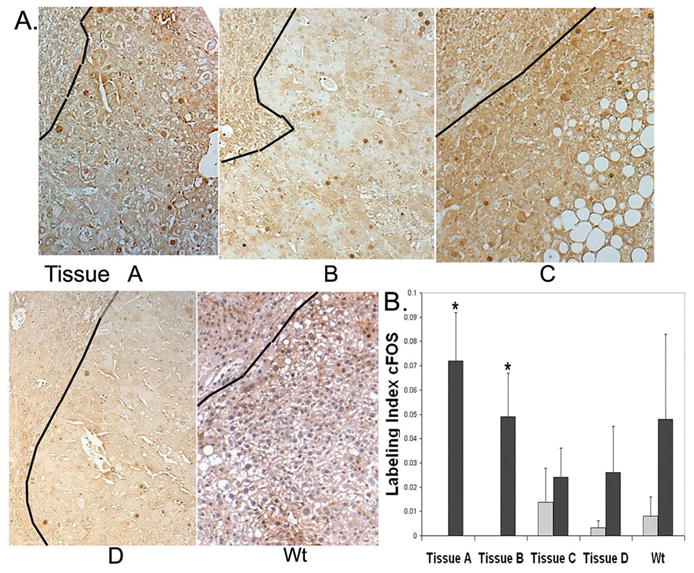
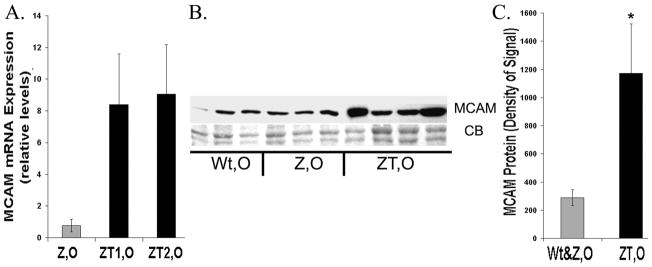
Results: By 16-19 months of age, approximately 69% of the PiZ mice had developed tumors. HCC was present with no evidence of benign adenomas as pre-cancerous lesions. Tumors showed abnormal mitochondria, variable levels of steatosis, globular inclusions of alpha1AT mutant Z protein and metastases. PiZ mice that subsequently developed liver tumors had higher serum levels of alpha1AT mutant Z protein than those that did not develop tumors. Cyclin D1, a cell cycle protein, was upregulated in PiZ livers without tumors compared to Wt. cFOS, a component of AP-1 that may be involved in transforming cells and MCAM, an adhesion molecule likely involved in tumorigenesis and metastases, were elevated in tumors compared with livers without tumors.

Conclusion: In the PiZ model, many of the histological characteristics of HCC recapitulated features seen in human HCC, whether from individuals with homozygous ZZ liver disease or from unrelated causes in individuals that were not homozygous ZZ. The accumulation of mutant Z protein altered the regulation of several genes driving proliferation and tumorigenesis.


Figures

Figure 1
Figure 1
Tumors from Wt and PiZ mice A. Incidence of liver tumors as a function of age. Black bars=PIZ; open bars=Wt; 14–15 months (n=28 PiZ; n=21 Wt); 16–19 months (n=49 PiZ; n=31 Wt, 1 tumor HCC); 20–24 months (n=39 PiZ; n=35 Wt, 1 tumor, angiosarcoma) *Significant difference from PiZ 20–24 months, P=0.002 and PiZ 16–19 months, P<0.05. **Significant difference between PiZ & Wt, P<0.001. B. H&E of Wt tumor, HCC in upper right, adjacent tissue approximately to the left of diagonal line (50X, X refers to original magnification) C. H&E of HCC in PiZ liver with floating trabeculae. (50X) D. Metastatic HCC in PiZ, liver with floating trabeculae, left panel (50X), middle panel and right panel, lung metastases (400X & 100X) E. Electron photomicrograph of HCC from PiZ mouse liver. Normal mitochondrion, m; mega-mitochondrion, M; crystalline inclusion, C; nucleus, N; fat droplet, F; globule, G. Lower left, bar= 500 nm F. Representative tumors and adjacent tissues from 4 mice: top row, Tissue A; second row, Tissue B; third row, Tissue C; bottom row, Tissue D. Left panel, top to bottom, IHC for α1AT, tumor areas stain more than adjacent areas. Right panel, top to bottom, PAS+ diastase digestion: red globules. (50X) G. Percent area occupied by globules in adjacent or tumor regions in each tissue from the right panel of F. Morphometrc quantification: five random microscope fields/tumor and five fields/adjacent region. Values are means (+/−) S.E. A,B,C,D = Tissues A – D. Gray bars=adjacent tissue; black bars =tumor tissue. *P<0.001
Figure 2
Figure 2
Cyclin D1 expression is elevated in PiZ mice. A. qRT-PCR for cyclin D1 in PiZ mice Values represent relative increases above the values for age-matched Wt mice and are calculated as means (+/−) S.E. bars: light gray Z,Y =PiZ, young ( n=4); dark gray Z,O=PiZ, older (n=3) Wt,Y= Wt, young (n=4); Wt,O=Wt, older (n=3). B. Typical immunoblot of cyclin D1. Actin: loading control. C. Quantification: fraction of nuclei positive for cyclin D1. Values are means (+/−) S.E. calculated using 10 microscope fields per specimen. (200X) Bars: unshaded Wt, O (2 Wt mice, specimens stained for cyclin D1)), dark grey Z, O. (2 PiZ mice, specimens stained for cyclin D1). *Significant difference P<0.001
Figure 3
Figure 3
Heterogeneity of expression of cyclin D1 and Ki67 in representative tissues, A through D and Wt, HCC. Tumors with HCC are on the right side of each photomicrograph; adjacent regions are on the left side. Dark line: approximate boundary between tumors and adjacent regions. Upper row, Cyclin D1 staining; bottom row, Ki67 staining (Original magnification 200X)
Figure 4
Figure 4
Quantification of cyclin D1 and Ki67 in tumors. A. qRT-PCR for cyclin D1 in tumor tissue as fold increase relative to Wt, non-tumor. Bars: black, ZT1, O= pooled tumors set 1, older, n=3 or ZT2, O= pooled tumor set 2, older, n=3; Wt, older (n=3). B. Fraction of total nuclei staining for cyclin D1 in tumors and adjacent regions. Counts were from 5 random microscope fields per tumor and 5 per adjacent region. Values are means (+/−) S.E. Bars: light gray, adjacent region; black, tumor region. *Significant difference from adjacent region, P=0.01. C. Fraction of the Ki67 positive nuclei in tumors and adjacent regions. Symbols as in B. *P≤ 0.006.
Figure 5
Figure 5
Tissue stained for cyclin D1, treated with PAS and diastase digested (no counterstain) A–C. A. Non-tumor tissue, globules, ~2 cyclin D1 positive nuclei, arrow B. Tissue D, tumor with tiny globules, no cyclin D1 staining shown C. Cyclin D1 in tumor hepatocyte with globules, arrow. D.(No PAS stain): Ki67 stain in tumor, globules appear as white spheres. (Original magnification 400X.) E. SOCS3, Tissue D, transitional region on left, tumor on right F. & G. PSTAT3 (enhanced DAB only), transitional left, tumor right.
Figure 6
Figure 6
Expression of Socs3 and STAT3 A. qRT-PCR. Levels of Socs3 mRNA measured in PiZ older or in pooled tumor sets. Values are fold increases relative to age matched Wt non-tumor. See Figures 2 and 4 for symbols and n-values. B. Typical immunoblots of PSTAT3 and STAT3 measured in Wt, O and Z, O. STAT3: 2 isoforms. Actin: loading control. # indomethacin treated, positive control. C. Quantification of typical immunoblot. Signals (densities) were calculated in ImageJ. No significant difference in STAT3, P> 0.05.
Figure 7
Figure 7
Levels of cFOS expression vary in tumor tissue. A. Nuclear staining for cFOS shown in tissues A–D and Wt. Each photomicrograph has approximate tumor area to right of black line, adjacent area to the left. B. Quantification: approximate labeling index of cFOS. Counting procedures and symbols as in Fig. 4B. *P<0.05.
Figure 8
Figure 8
Expression of MCAM A. qRT-PCR on MCAM mRNA, PiZ mice relative to Wt. Symbols as above. (n=3 for each category, Wt,O; PiZ,O; ZT1,O; ZT2,O) B. Typical immunoblot of MCAM liver homogenates from Wt, O; Z, O; and individual ZT, O. CB: Coomassie blue loading control. C. Quantification of typical immunoblot as in Figure 6. Symbols: gray= non-tumor (Wt, O & Z, O) black= ZT, O *Significant difference P= 0.014.

References

    1. Huber R, Carrell RW. Implications of the three-dimensional structure of alpha 1-antitrypsin for structure and function of serpins. Biochemistry. 1989;28:8951–66. - PubMed
    1. Teckman JH, Qu D, Perlmutter DH. Molecular pathogenesis of liver disease in alpha1-antitrypsin deficiency. Hepatology. 1996;24:1504–16. - PubMed
    1. Rudnick DA, Perlmutter DH. Alpha-1-antitrypsin deficiency: a new paradigm for hepatocellular carcinoma in genetic liver disease. Hepatology. 2005;42:514–21. - PubMed
    1. Propst T, Propst A, Dietze O, Judmaier G, Braunsteiner H, Vogel W. Prevalence of hepatocellular carcinoma in alpha-1-antitrypsin deficiency. J Hepatol. 1994;21:1006–11. - PubMed
    1. Perlmutter DH. Pathogenesis of chronic liver injury and hepatocellular carcinoma in alpha-1-antitrypsin deficiency. Pediatr Res. 2006;60:233–8. - PubMed