

Evaluation of LMP1 of Epstein-Barr virus as a therapeutic target by its inhibition
- PMID: 20618963
- PMCID: PMC2913984
- DOI: 10.1186/1476-4598-9-184
Evaluation of LMP1 of Epstein-Barr virus as a therapeutic target by its inhibition
Abstract
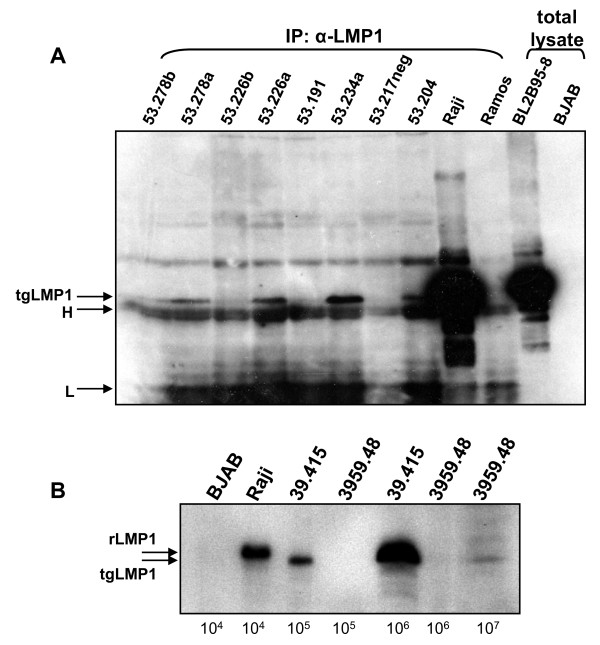
Background: The latent membrane protein-1 (LMP1) encoded by Epstein-Barr virus (EBV) is an oncoprotein which acts by constitutive activation of various signalling pathways, including NF-kappaB. In so doing it leads to deregulated cell growth intrinsic to the cancer cell as well as having extrinsic affects upon the tumour microenvironment. These properties and that it is a foreign antigen, lead to the proposition that LMP1 may be a good therapeutic target in the treatment of EBV associated disease. LMP1 is expressed in several EBV-associated malignancies, notably in Hodgkin's lymphoma and nasopharyngeal carcinoma (NPC). However, the viral protein is only detected in approximately 30%-50% of NPC samples, as such its role in carcinogenesis and tumour maintenance can be questioned and thus its relevance as a therapeutic target.
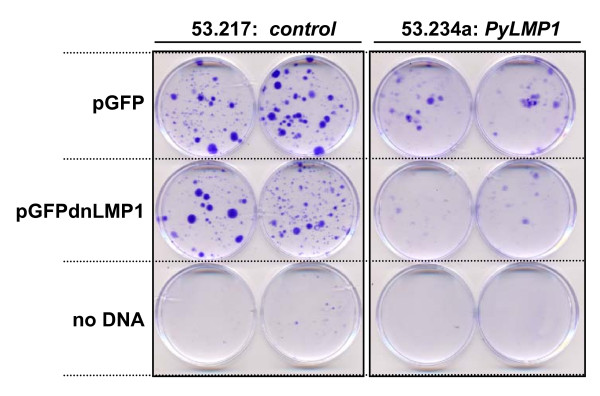
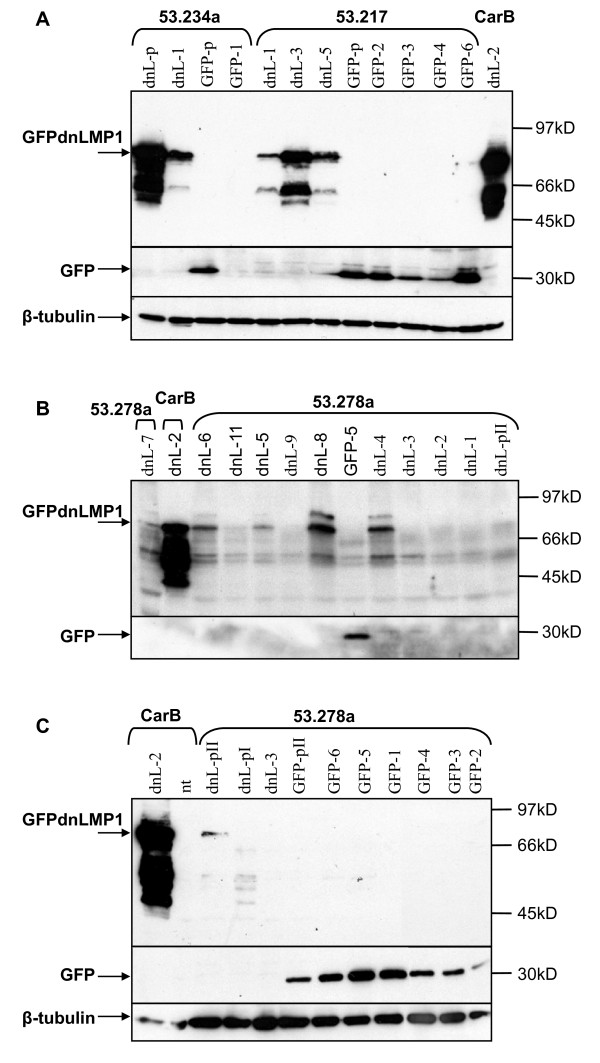
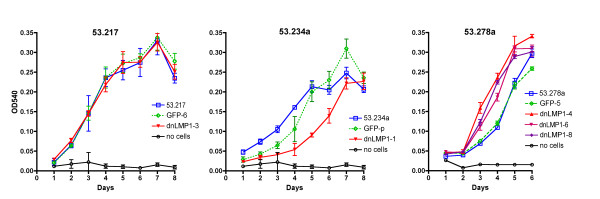
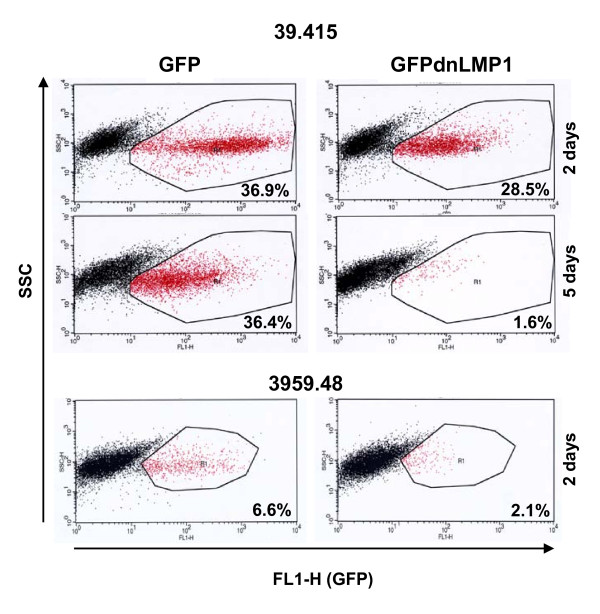
Results: In order to explore if LMP1 has a continuous function in established tumours, its activity was inhibited through expression of a dominant negative LMP1 mutant in tumour cell lines derived from transgenic mice. LMP1 is the tumour predisposing oncogene in two different series of transgenic mice which separately give rise to either B-cell lymphomas or carcinomas. Inhibition of LMP1 activity in the carcinoma cell lines lead to a reduction in clonagenicity and clone viability in all of the cell lines tested, even those with low or below detection levels of LMP1. Inhibition of LMP1 activity in the transgenic B-cell lines was incompatible with growth and survival of the cells and no clones expressing the dominant negative LMP1 mutant could be established.
Conclusions: LMP1 continues to provide a tumour cell growth function in cell lines established from LMP1 transgenic mouse tumours, of both B-cell and epithelial cell origin. LMP1 can perform this function, even when expressed at such low levels as to be undetectable, whereby evidence of its expression can only be inferred by its inhibition being detrimental to the growth of the cell. This raises the possibility that LMP1 still performs a pro-oncogenic function in the 50% to 70% of NPC tumours wherein LMP1 protein expression cannot be detected. This reinforces the basis for pursuing LMP1 as a therapeutic target in EBV associated LMP1-expressing malignancies.
Figures

Similar articles
-
Activation of sterol regulatory element-binding protein 1 (SREBP1)-mediated lipogenesis by the Epstein-Barr virus-encoded latent membrane protein 1 (LMP1) promotes cell proliferation and progression of nasopharyngeal carcinoma.J Pathol. 2018 Oct;246(2):180-190. doi: 10.1002/path.5130. Epub 2018 Aug 22. J Pathol. 2018. PMID: 29968360 Free PMC article.
-
Regulation of DNA Damage Signaling and Cell Death Responses by Epstein-Barr Virus Latent Membrane Protein 1 (LMP1) and LMP2A in Nasopharyngeal Carcinoma Cells.J Virol. 2015 Aug;89(15):7612-24. doi: 10.1128/JVI.00958-15. Epub 2015 May 13. J Virol. 2015. PMID: 25972552 Free PMC article.
-
NF-κB Signaling Regulates Expression of Epstein-Barr Virus BART MicroRNAs and Long Noncoding RNAs in Nasopharyngeal Carcinoma.J Virol. 2016 Jun 24;90(14):6475-88. doi: 10.1128/JVI.00613-16. Print 2016 Jul 15. J Virol. 2016. PMID: 27147748 Free PMC article.
-
A therapeutic approach to nasopharyngeal carcinomas by DNAzymes targeting EBV LMP-1 gene.Molecules. 2010 Sep 1;15(9):6127-39. doi: 10.3390/molecules15096127. Molecules. 2010. PMID: 20877211 Free PMC article. Review.
-
Modulation of the tumor microenvironment by Epstein-Barr virus latent membrane protein 1 in nasopharyngeal carcinoma.Cancer Sci. 2018 Feb;109(2):272-278. doi: 10.1111/cas.13473. Epub 2018 Jan 21. Cancer Sci. 2018. PMID: 29247573 Free PMC article. Review.
Cited by
-
EBV-LMP1 targeted DNAzyme enhances radiosensitivity by inhibiting tumor angiogenesis via the JNKs/HIF-1 pathway in nasopharyngeal carcinoma.Oncotarget. 2015 Mar 20;6(8):5804-17. doi: 10.18632/oncotarget.3331. Oncotarget. 2015. PMID: 25714020 Free PMC article.
-
Up-regulated chitinase-like protein-1 promotes tumour growth while physiological levels are protective.Life Sci Alliance. 2025 Aug 6;8(10):e202403138. doi: 10.26508/lsa.202403138. Print 2025 Oct. Life Sci Alliance. 2025. PMID: 40769579 Free PMC article.
-
Pathogenic Role of Exosomes in Epstein-Barr Virus (EBV)-Associated Cancers.Int J Biol Sci. 2017 Sep 21;13(10):1276-1286. doi: 10.7150/ijbs.19531. eCollection 2017. Int J Biol Sci. 2017. PMID: 29104494 Free PMC article. Review.
-
B1.12: a novel peptide interacting with the extracellular loop of the EBV oncoprotein LMP1.Sci Rep. 2019 Mar 13;9(1):4389. doi: 10.1038/s41598-019-39732-y. Sci Rep. 2019. PMID: 30867462 Free PMC article.
-
EBV based cancer prevention and therapy in nasopharyngeal carcinoma.NPJ Precis Oncol. 2017 May 15;1(1):10. doi: 10.1038/s41698-017-0018-x. eCollection 2017. NPJ Precis Oncol. 2017. PMID: 29872698 Free PMC article.
References
-
- Kieff E, Rickinson AB. In: in Fields Virology. Knipe DM, Howley PM, Griffin DE, editor. Lippincott Williams & Wilkins, Philadelphia; 2001. pp. 2511–2573.
Publication types
MeSH terms
Substances
Grants and funding
LinkOut - more resources
Full Text Sources
Molecular Biology Databases
Research Materials
