. 2010 Jul 9:11:26.
doi: 10.1186/1471-2091-11-26.

Loss of the SIN3 transcriptional corepressor results in aberrant mitochondrial function

Affiliations

Loss of the SIN3 transcriptional corepressor results in aberrant mitochondrial function

Valerie L Barnes et al. BMC Biochem. .

Abstract

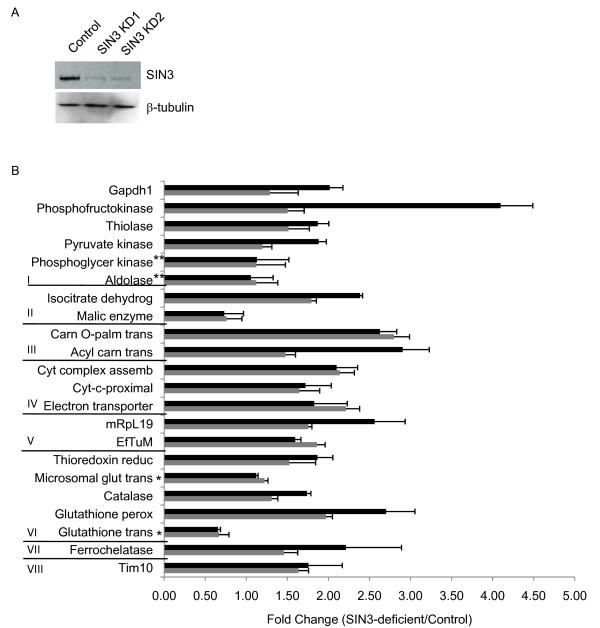
Background: SIN3 is a transcriptional repressor protein known to regulate many genes, including a number of those that encode mitochondrial components.

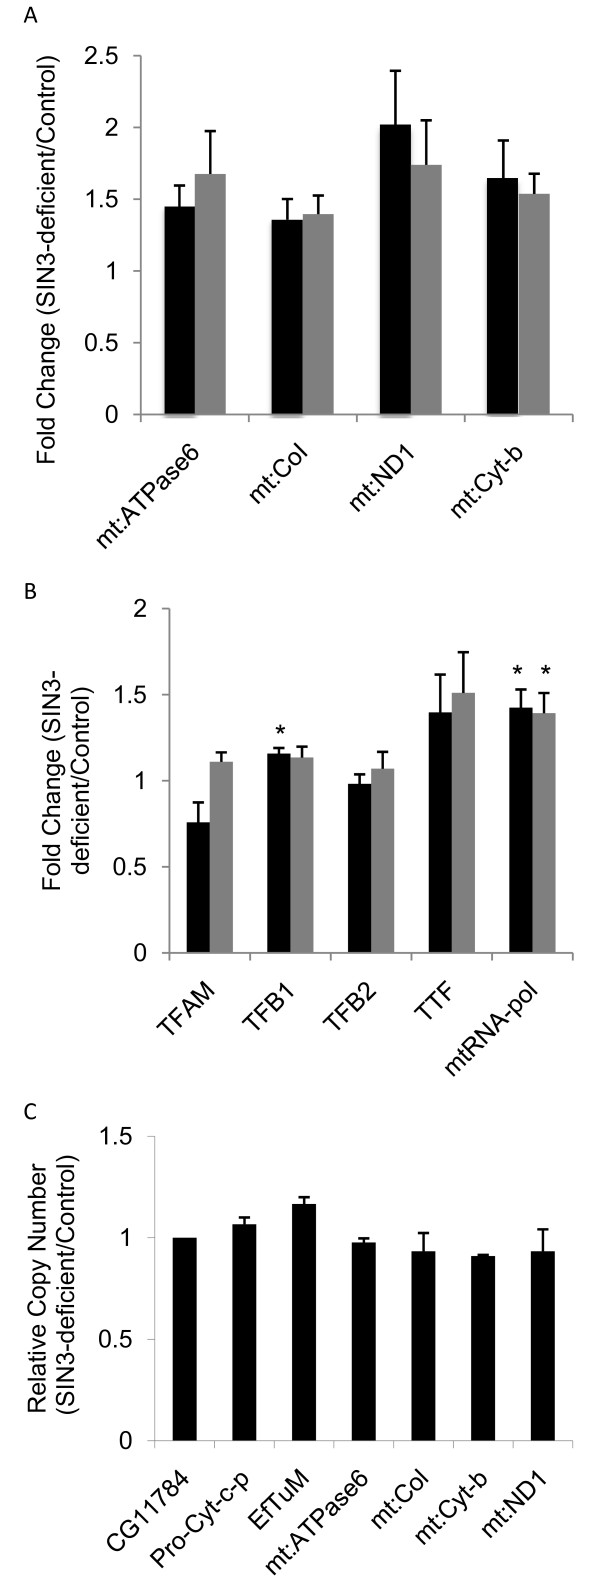
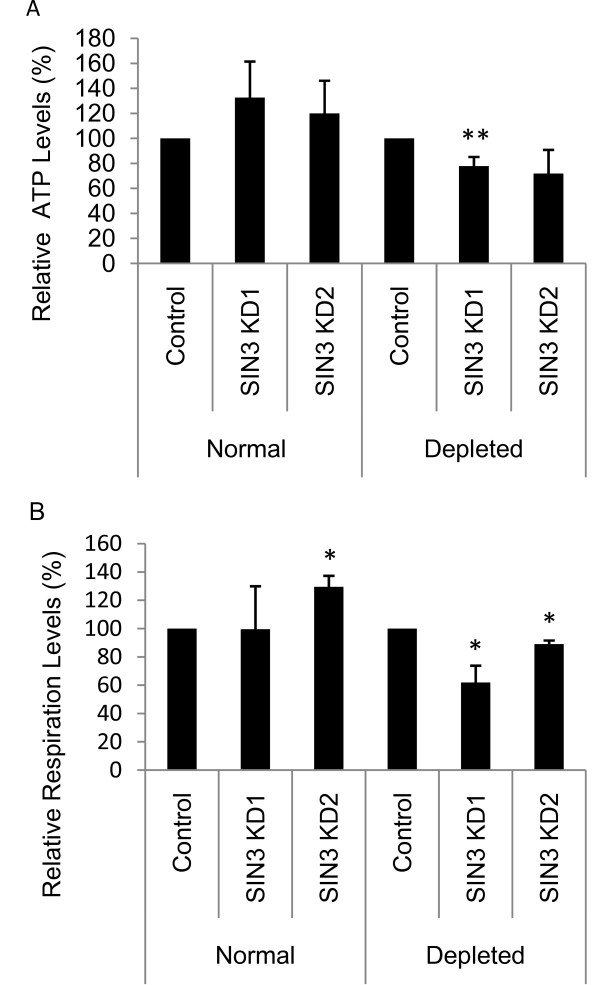
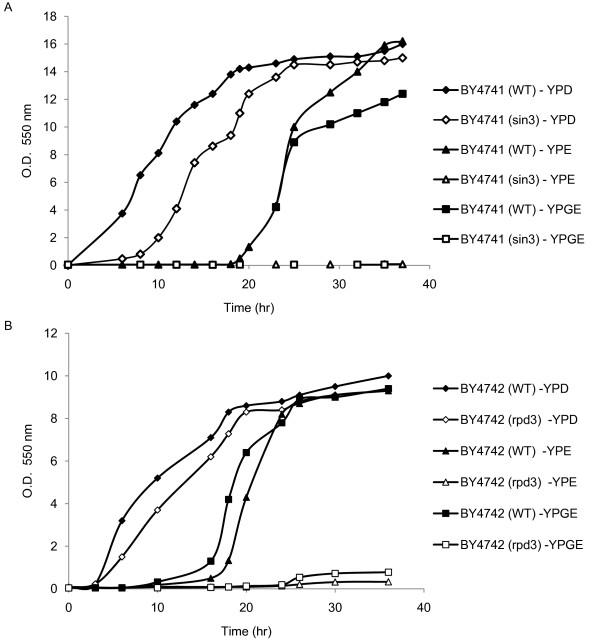
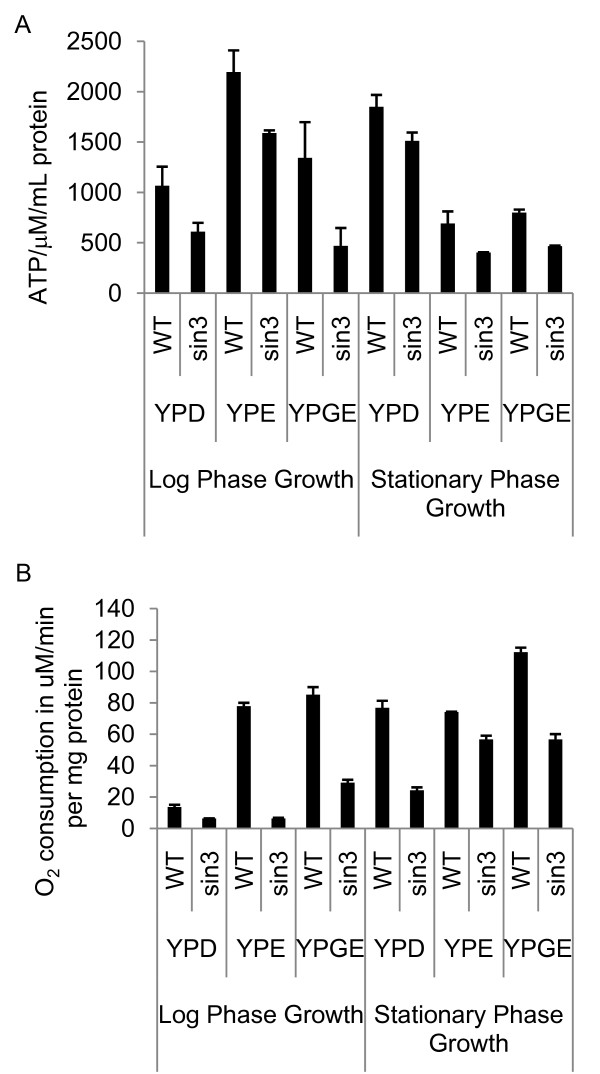
Results: By monitoring RNA levels, we find that loss of SIN3 in Drosophila cultured cells results in up-regulation of not only nuclear encoded mitochondrial genes, but also those encoded by the mitochondrial genome. The up-regulation of gene expression is accompanied by a perturbation in ATP levels in SIN3-deficient cells, suggesting that the changes in mitochondrial gene expression result in altered mitochondrial activity. In support of the hypothesis that SIN3 is necessary for normal mitochondrial function, yeast sin3 null mutants exhibit very poor growth on non-fermentable carbon sources and show lower levels of ATP and reduced respiration rates.

Conclusions: The findings that both yeast and Drosophila SIN3 affect mitochondrial activity suggest an evolutionarily conserved role for SIN3 in the control of cellular energy production.


Figures

Figure 1
Figure 1
Expression of nuclear encoded genes involved in multiple mitochondrial processes is up-regulated following loss of SIN3. SIN3-deficient cells were generated by RNAi methodology using dsRNA generated against different regions of the SIN3 transcript KD1 (black bars) or KD2 (gray bars). (A) Western blot analysis of whole cell extracts prepared from control or SIN3-deficient cells as indicated. The blots were probed with antibody to SIN3 or to β-tubulin as a loading control. (B) qPCR was performed using cDNA prepared from control and SIN3-deficient cells as a template and primer pairs for the genes indicated along the Y-axis. Relative levels of gene expression are indicated. *Genes with decreased expression in microarray. **Genes with no expression level change in microarray. Genes are grouped according to process: I-glycolysis, II-citric acid cycle, III-fatty acid oxidation, IV-oxidative phosphorylation, V-mitochondrial biogenesis, VI-reactive oxygen species (ROS) pathways, VII-heme synthesis, and VIII-transporter. Error bars represent standard error (n = 3-6 for KD1 and n = 3-5 for KD2). p ≤ 0.05 for all data.
Figure 2
Figure 2
Analysis of mitochondrial gene expression and genome copy number. Expression analysis of mitochondrial encoded genes (A) and nuclear encoded mitochondrial transcription factors (B). Total RNA isolated from control and SIN3-deficient cells (KD1, black bars, and KD2, gray bars) was used to generate cDNA. qPCR was performed using the cDNA as a template and primer pairs for the genes indicated along the X-axis. Relative levels of gene expression are indicated. Error bars represent standard error. A, n = 7 for KD1 and n = 5 for KD2, p < 0.05 for all data. B, n = 4, *p < 0.05. (C) Mitochondrial DNA copy number is unaltered following loss of SIN3. DNA was isolated from control and SIN3-deficient cells. qPCR was performed using the DNA as a template and primer pairs for both nuclear and mitochondrial genome sequences as indicated along the X-axis. Pro-cyt-c-p amplifies the promoter region of Cyt-c-p. Relative copy number is indicated. The nuclear gene glutathione transferase (CG11784) was used for normalization. Error bars represent standard error (n = 3).
Figure 3
Figure 3
ATP levels and respiration are affected in S2 cells following loss of SIN3 in nutrient depleted conditions. (A) ATP levels of S2 cells grown in normal or depleted media with and without SIN3. Error bars represent standard error (n = 3-5). **p = 0.02. ATP present in whole cell extracts prepared from control and SIN3-deficient cells was quantified using the bioluminescent method. (B) Relative respiration levels in S2 cells grown in normal or depleted media with and without SIN3 (n = 3). Error bars represent standard error. *p < 0.05.
Figure 4
Figure 4
S. cerevisiae SIN3 and RPD3 are critical for growth in media prepared with non-fermentable carbon sources. Wild type (BY4741 WT), sin3 null mutant (BY4741 sin3) (A), wild type (BY4742 WT) and rpd3 null mutant (BY4742 rpd3) (B) cells were grown in 5 ml of YPD, washed twice with water, inoculated into media containing glucose (YPD), ethanol (YPE) and glycerol and ethanol (YPGE) as sole carbon sources and incubated at 30°C. Absorbance at 550 nm was measured at the indicated times. Representative results of single growth curve assays are shown. A minimum of three independent trials was performed and all produced similar results.
Figure 5
Figure 5
ATP levels and respiration are decreased in yeast sin3 null mutants. (A) ATP levels of yeast grown in YPD and non-fermentable carbon sources measured as ATP/μM/mg protein. Error bars represent standard error (n = 3). ATP present in whole cell extracts prepared from control and SIN3-deficient yeast was quantified using the bioluminescent method. (B) Respiration levels of yeast grown in YPD and non-fermentable carbon sources measured as O2 consumption in μM/min per mg of protein. Error bars represent standard deviation.

References

    1. Scarpulla RC. Nuclear control of respiratory chain expression by nuclear respiratory factors and PGC-1-related coactivator. Ann N Y Acad Sci. 2008;1147:321–334. - PMC - PubMed
    1. Scarpulla RC. Nuclear activators and coactivators in mammalian mitochondrial biogenesis. Biochim Biophys Acta. 2002;1576(1-2):1–14. - PubMed
    1. Hughes TR, Marton MJ, Jones AR, Roberts CJ, Stoughton R, Armour CD, Bennett HA, Coffey E, Dai H, He YD. Functional discovery via a compendium of expression profiles. Cell. 2000;102(1):109–126. doi: 10.1016/S0092-8674(00)00015-5. - DOI - PubMed
    1. Mootha VK, Bunkenborg J, Olsen JV, Hjerrild M, Wisniewski JR, Stahl E, Bolouri MS, Ray HN, Sihag S, Kamal M. Integrated analysis of protein composition, tissue diversity, and gene regulation in mouse mitochondria. Cell. 2003;115(5):629–640. doi: 10.1016/S0092-8674(03)00926-7. - DOI - PubMed
    1. Pile LA, Spellman PT, Katzenberger RJ, Wassarman DA. The SIN3 deacetylase complex represses genes encoding mitochondrial proteins: implications for the regulation of energy metabolism. J Biol Chem. 2003;278(39):37840–37848. doi: 10.1074/jbc.M305996200. - DOI - PubMed

Publication types

MeSH terms

Substances