Clinical Trial
. 2010 Aug 31;28(38):6367-73.
doi: 10.1016/j.vaccine.2010.06.084. Epub 2010 Jul 7.

Safety and immunogenicity of HCV E1E2 vaccine adjuvanted with MF59 administered to healthy adults

Affiliations
Clinical Trial

Safety and immunogenicity of HCV E1E2 vaccine adjuvanted with MF59 administered to healthy adults

Sharon E Frey et al. Vaccine. .

Abstract

Background: Hepatitis C virus (HCV) causes chronic liver disease that often leads to cirrhosis and hepatocellular carcinoma. In animal studies, chimpanzees were protected against chronic infection following experimental challenge with either homologous or heterologous HCV genotype 1a strains which predominate in the USA and Canada. We describe the first in humans clinical trial of this prophylactic HCV vaccine.

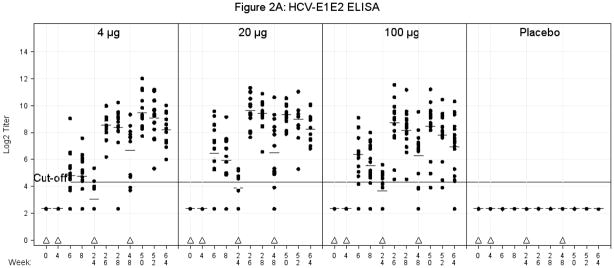
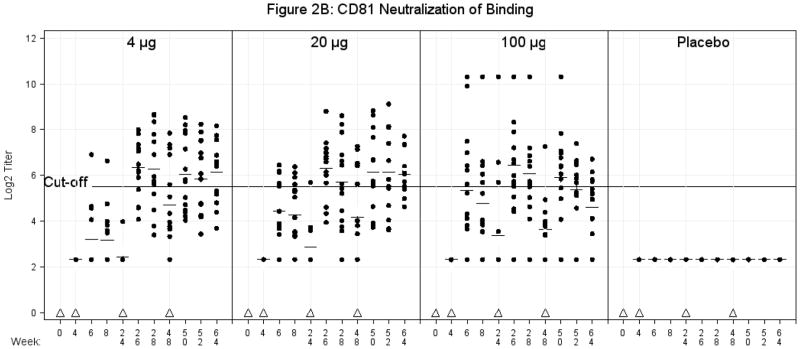
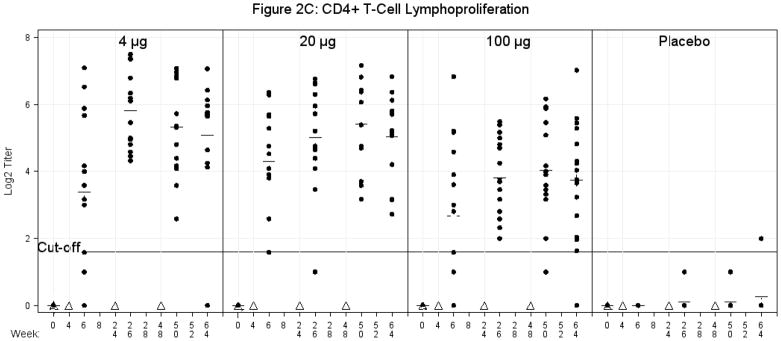
Methods: HCV E1E2 adjuvanted with MF59C.1 (an oil-in-water emulsion) was given at 3 different dosages on day 0 and weeks 4, 24 and 48 in a phase 1, placebo-controlled, dose escalation trial to healthy HCV-negative adults.

Results: There was no significant difference in the proportion of subjects reporting adverse events across the groups. Following vaccination subjects developed antibodies detectable by ELISA, CD81 neutralization and VSV/HCV pseudotype neutralization. There were no significant differences between vaccine groups in the number of responders and geometric mean titers for each of the three assays. All subjects developed lymphocyte proliferation responses to E1E2 and an inverse response to increasing amounts of antigen was noted.

Conclusions: The vaccine was safe and generally well-tolerated at each of the 3 dosage levels and induced antibody and lymphoproliferative responses. A larger study to further evaluate safety and immunogenicity is warranted.

Trial registration: ClinicalTrials.gov NCT00500747.


Figures

Figure 1
Figure 1
A. Percent of Subjects with Maximum Local Reactogenicity by Dose and Vaccination. Reactogenicity data was summarized as maximum severity for each symptom after each vaccination. The most common solicited reaction is pain/tenderness at the injections site. A similar number of moderate events followed each vaccination. Severe reactions occurred in subjects receiving the 20 μg dose following the third vaccination. The proportion of subjects experiencing mild or greater severity of reactogenicity is not associated with assigned dosage level (p < 0.05, exact test). B. Maximum Systemic Reactogenicity by Dose and Vaccination. Systemic reactogenicity data was solicited for 15 days (Study days 0–14) after each vaccination and was recorded on a diary card. Subjects graded reactogenicity as mild, moderate or severe. Mild was defined as awareness of symptom but easily tolerated and did not keep the subject from normal, daily activities; moderate was defined as the subject acting like something was wrong and resulted in some limitation in the subject’s normal daily activities; and severe was defined as being extremely distressed or unable to do normal daily activities. Reactogenicity was summarized as maximum severity for each symptom after each vaccination. A similar number of moderate events followed each vaccination. Severe reactions occurred in subjects receiving the 20 μg dose following the second and third vaccinations. The proportion of subjects experiencing mild or greater severity of reactogenicity is not associated with assigned dosage level (p < 0.05, exact test).
Figure 1
Figure 1
A. Percent of Subjects with Maximum Local Reactogenicity by Dose and Vaccination. Reactogenicity data was summarized as maximum severity for each symptom after each vaccination. The most common solicited reaction is pain/tenderness at the injections site. A similar number of moderate events followed each vaccination. Severe reactions occurred in subjects receiving the 20 μg dose following the third vaccination. The proportion of subjects experiencing mild or greater severity of reactogenicity is not associated with assigned dosage level (p < 0.05, exact test). B. Maximum Systemic Reactogenicity by Dose and Vaccination. Systemic reactogenicity data was solicited for 15 days (Study days 0–14) after each vaccination and was recorded on a diary card. Subjects graded reactogenicity as mild, moderate or severe. Mild was defined as awareness of symptom but easily tolerated and did not keep the subject from normal, daily activities; moderate was defined as the subject acting like something was wrong and resulted in some limitation in the subject’s normal daily activities; and severe was defined as being extremely distressed or unable to do normal daily activities. Reactogenicity was summarized as maximum severity for each symptom after each vaccination. A similar number of moderate events followed each vaccination. Severe reactions occurred in subjects receiving the 20 μg dose following the second and third vaccinations. The proportion of subjects experiencing mild or greater severity of reactogenicity is not associated with assigned dosage level (p < 0.05, exact test).
Figure 2
Figure 2
A. E1E2 Binding Antibody ELISA. Serum was obtained for E1E2 binding antibody at multiple time points as indicated. There were no significant differences in comparisons among the 4μg, 20μg, or 100μg vaccine groups for Geometric Mean Titers or number of responders at any time points post vaccination. The values are expressed as Log2 titers. The titers of the antibodies are expressed as the reciprocal of the sample dilution, in which the optical density of the samples is between 1.0 and 0.5 (1.0 > OD > 0.5) as read by a plate reader using dual wavelengths of 492nm and 620 nm. A value of ≥20 (log2 4.32) was considered a positive response to vaccination. Triangles represent vaccination time points. Plus signs represent mean values. The solid line represents a cut-off value of 20 (log2 4.32). B. CD81 Neutralization of Binding Antibody. Serum was obtained for CD81 neutralization of binding antibody (geometric mean titers) at multiple time points as indicated. The values are expressed as Log2 titers. A titer of ≥ 45 (log2 4.32) or greater was considered a positive response to vaccination. Triangles represent vaccination time points. Plus signs represent mean values. The solid line represents the cut-off value of 45 (log2 5.49). C. Lymphoproliferation of CD4+ T-cell assay using E1E2 antigen. Cells were obtained for a CD4+ T-cell lymphoproliferation assay at multiple time points as indicated. Stimulation index (SI) = mean counts per minute (cpm) of duplicate stimulated cell cultures divided by mean cpm of duplicate unstimulated cell cultures. Stimulation index corresponding to a value of 1 is the lower limit of lymphoproliferation (LPA). SI of greater than or equal to 3 is considered a positive response to vaccination. Triangles represent vaccination time points. Plus signs represent mean values. The solid line represents a cut-off of 3 (log2 1.58).
Figure 2
Figure 2
A. E1E2 Binding Antibody ELISA. Serum was obtained for E1E2 binding antibody at multiple time points as indicated. There were no significant differences in comparisons among the 4μg, 20μg, or 100μg vaccine groups for Geometric Mean Titers or number of responders at any time points post vaccination. The values are expressed as Log2 titers. The titers of the antibodies are expressed as the reciprocal of the sample dilution, in which the optical density of the samples is between 1.0 and 0.5 (1.0 > OD > 0.5) as read by a plate reader using dual wavelengths of 492nm and 620 nm. A value of ≥20 (log2 4.32) was considered a positive response to vaccination. Triangles represent vaccination time points. Plus signs represent mean values. The solid line represents a cut-off value of 20 (log2 4.32). B. CD81 Neutralization of Binding Antibody. Serum was obtained for CD81 neutralization of binding antibody (geometric mean titers) at multiple time points as indicated. The values are expressed as Log2 titers. A titer of ≥ 45 (log2 4.32) or greater was considered a positive response to vaccination. Triangles represent vaccination time points. Plus signs represent mean values. The solid line represents the cut-off value of 45 (log2 5.49). C. Lymphoproliferation of CD4+ T-cell assay using E1E2 antigen. Cells were obtained for a CD4+ T-cell lymphoproliferation assay at multiple time points as indicated. Stimulation index (SI) = mean counts per minute (cpm) of duplicate stimulated cell cultures divided by mean cpm of duplicate unstimulated cell cultures. Stimulation index corresponding to a value of 1 is the lower limit of lymphoproliferation (LPA). SI of greater than or equal to 3 is considered a positive response to vaccination. Triangles represent vaccination time points. Plus signs represent mean values. The solid line represents a cut-off of 3 (log2 1.58).

References

    1. Seeff LB, Buskell-Bales Z, Wright EC, Durako SJ, Alter HJ, Iber FL, et al. Long-term mortality after transfusion-associated non-A, non-B hepatitis. N Engl J Med. 1992;327(27):1906–11. - PubMed
    1. Alter MJ, Margolis HS, Krawcynski K, Judson FN, Mares A, Alexander WJ, et al. The natural history of community-acquired hepatitis C in the United States. N Engl J Med. 1992;327(27):1899–905. - PubMed
    1. Tong MJ, El-Farra NS, Reikes AR, Co RL. Clinical outcomes after transfusion-associated hepatitis C. N Engl J Med. 1995;332(22):1463–6. - PubMed
    1. Fattovich G, Giustina G, Degos F, Tremolada F, Diodati G, Almasio P, et al. Morbidity and mortality in compensated cirrhosis type C: a retrospective follow-up study of 384 patients. Gastroenterol. 1997;112(2):463–72. - PubMed
    1. Araya V, Rakela J, Wright T. Hepatitis C after orthotopic liver transplantation. Gastroenterol. 1997;112(2):575–82. - PubMed

Publication types

MeSH terms

Associated data