. 2010 Aug 6;7(2):174-85.
doi: 10.1016/j.stem.2010.06.014. Epub 2010 Jul 8.

Hematopoietic stem cell quiescence promotes error-prone DNA repair and mutagenesis

Affiliations

Hematopoietic stem cell quiescence promotes error-prone DNA repair and mutagenesis

Mary Mohrin et al. Cell Stem Cell. .

Abstract

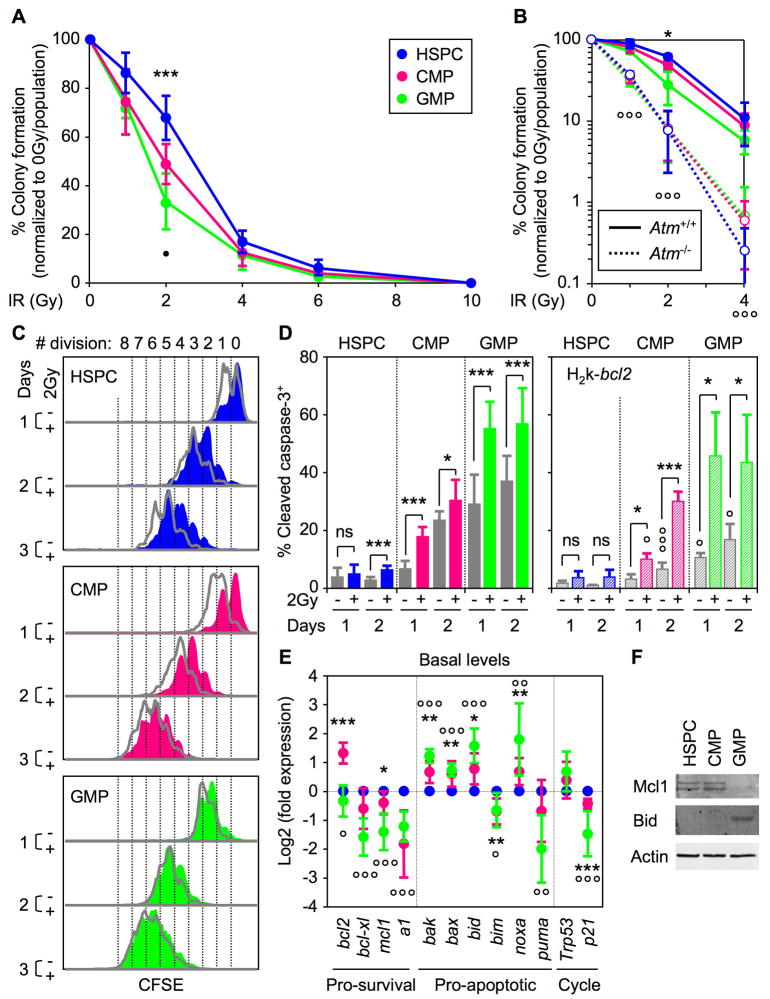
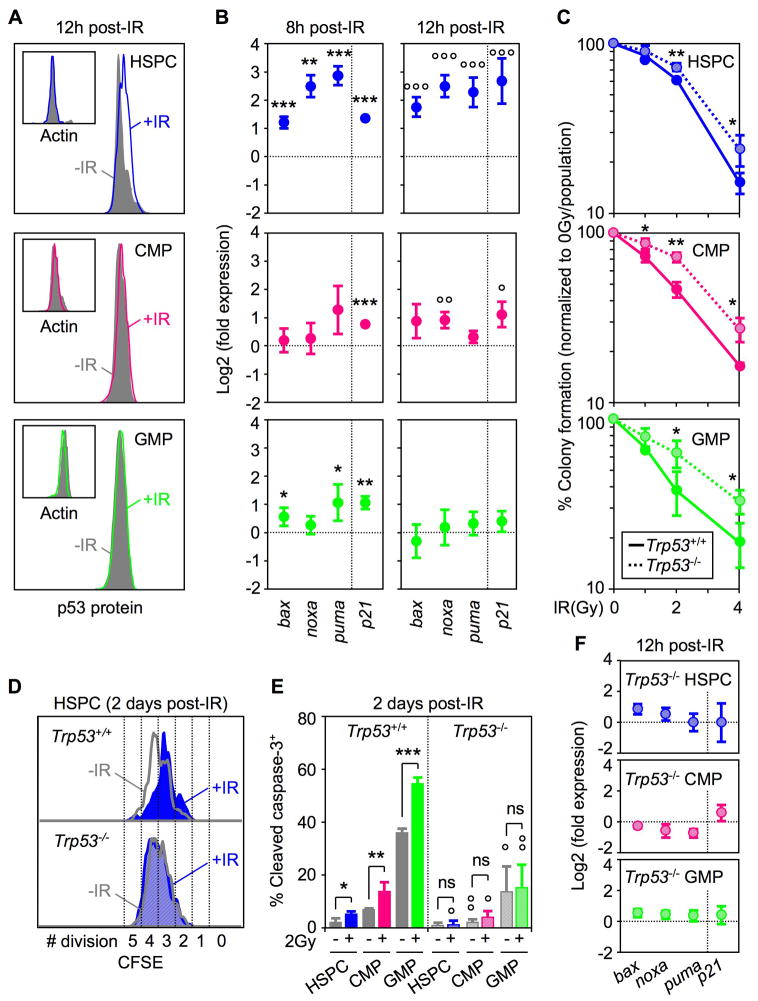
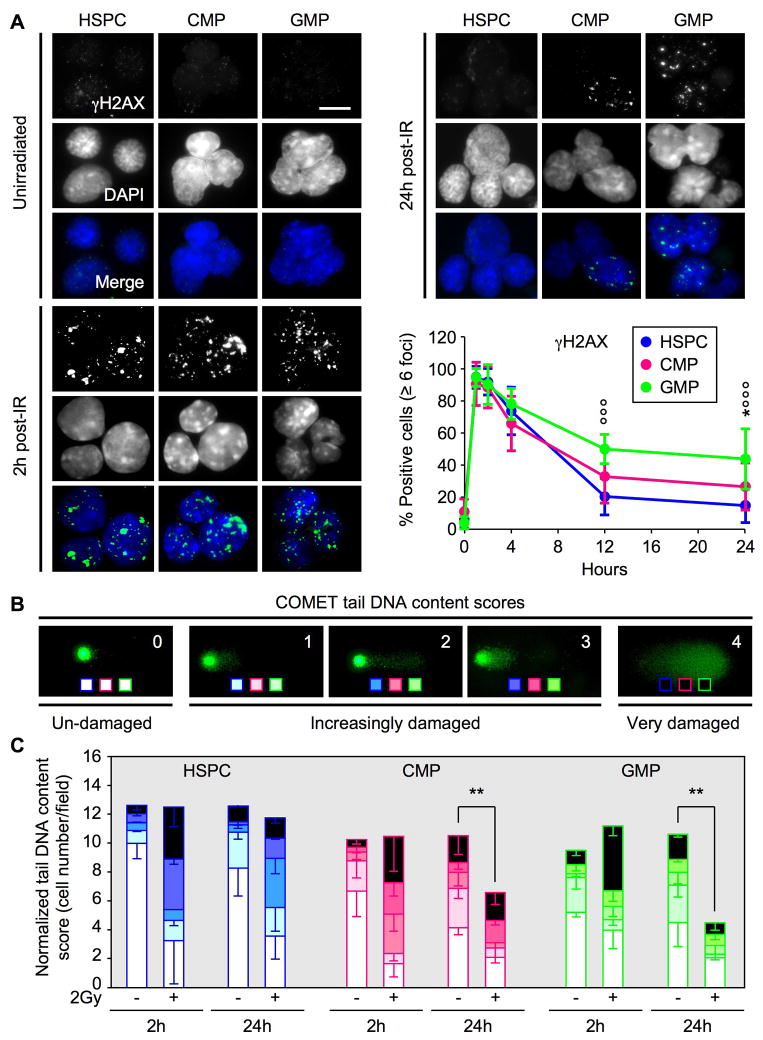
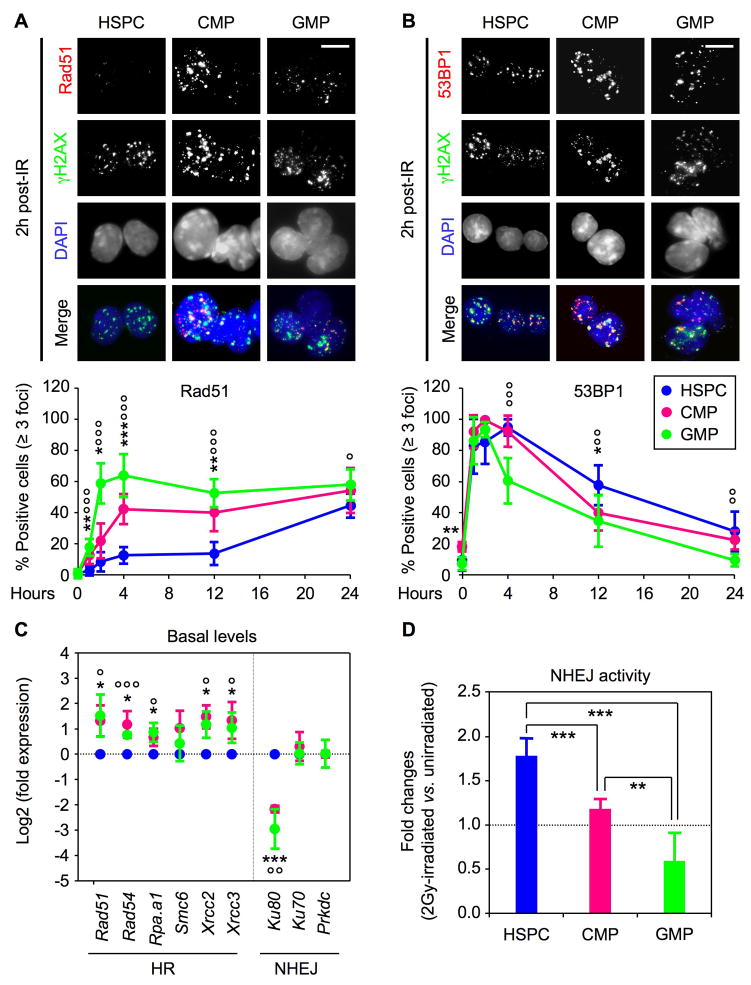
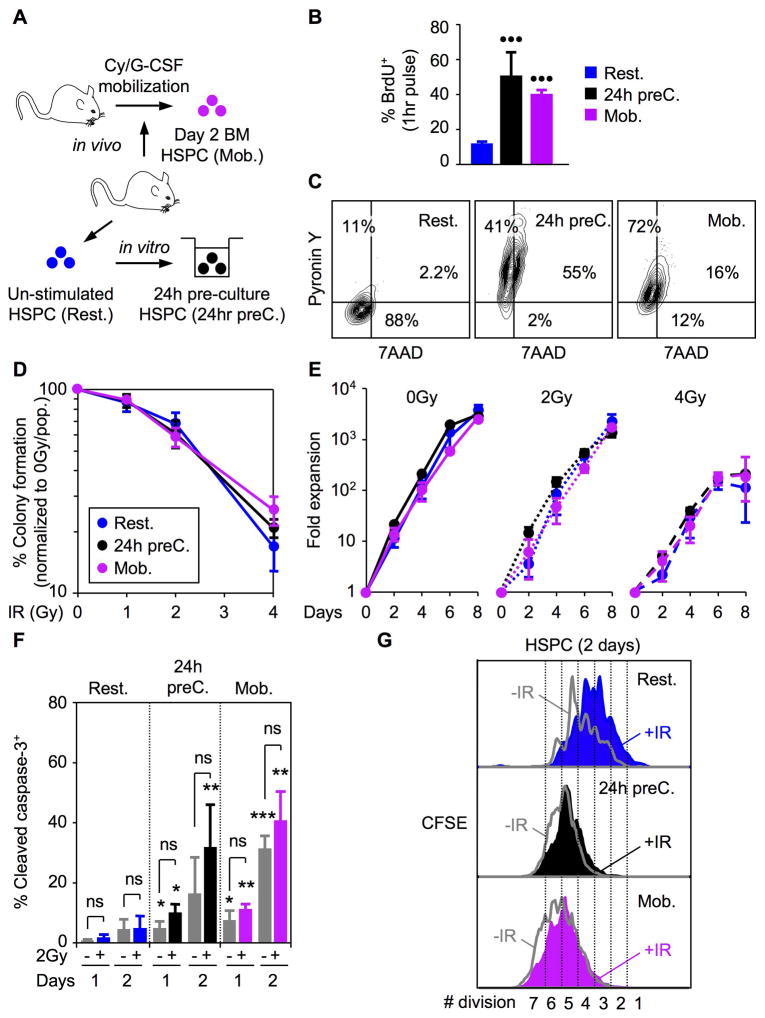
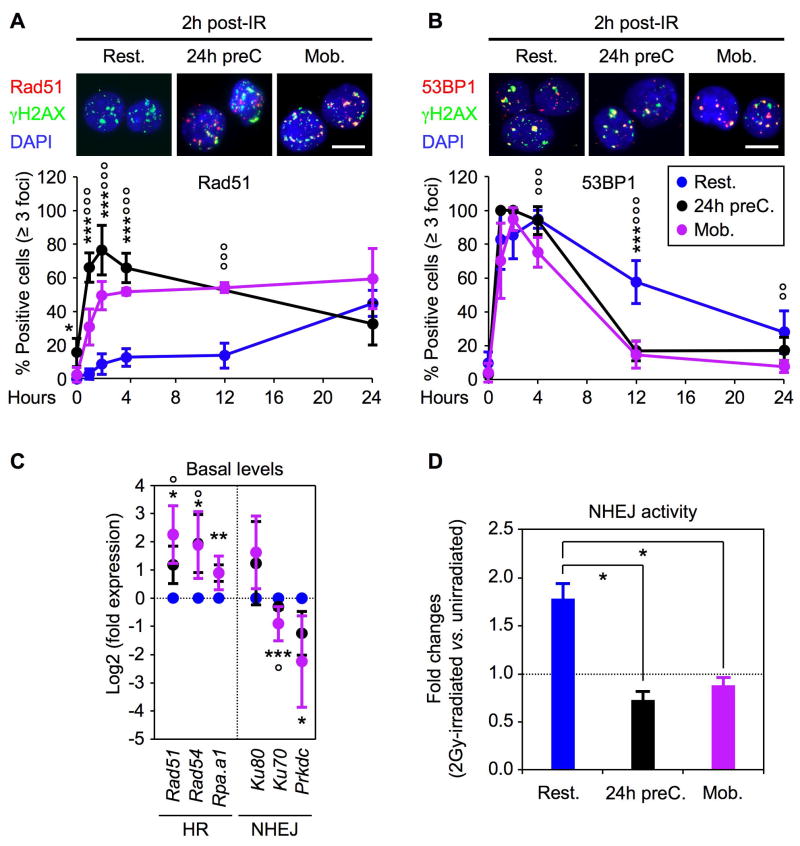
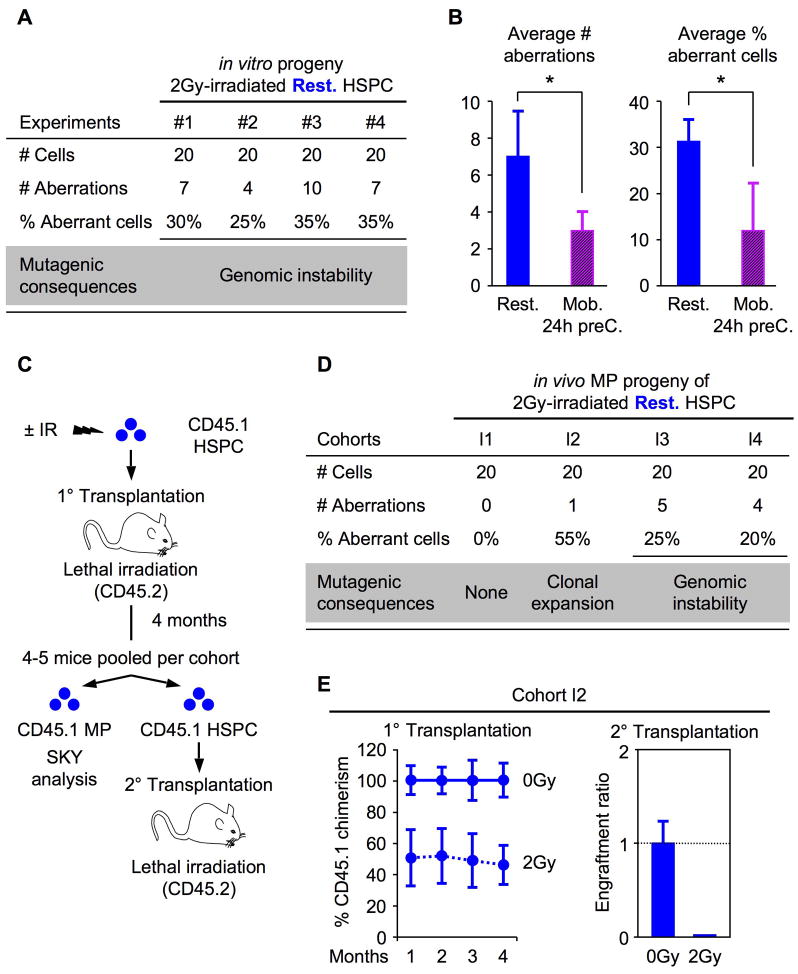
Most adult stem cells, including hematopoietic stem cells (HSCs), are maintained in a quiescent or resting state in vivo. Quiescence is widely considered to be an essential protective mechanism for stem cells that minimizes endogenous stress caused by cellular respiration and DNA replication. We demonstrate that HSC quiescence can also have detrimental effects. We found that HSCs have unique cell-intrinsic mechanisms ensuring their survival in response to ionizing irradiation (IR), which include enhanced prosurvival gene expression and strong activation of p53-mediated DNA damage response. We show that quiescent and proliferating HSCs are equally radioprotected but use different types of DNA repair mechanisms. We describe how nonhomologous end joining (NHEJ)-mediated DNA repair in quiescent HSCs is associated with acquisition of genomic rearrangements, which can persist in vivo and contribute to hematopoietic abnormalities. Our results demonstrate that quiescence is a double-edged sword that renders HSCs intrinsically vulnerable to mutagenesis following DNA damage.


Figures

Figure 1
Figure 1. HSPCs are intrinsically radioresistant and survive IR-induced cell killing
(A) Clonogenic survival assay of irradiated cells in methylcellulose (n = 9; ***p ≤ 0.001 [CMPs and GMPs vs. HSPCs]; •p ≤ 0.05 [GMPs vs. CMPs]). (B) Clonogenic survival assay of irradiated Atm−/− cells in methylcellulose (n = 3; *p ≤ 0.05 [Atm+/+ GMPs vs. Atm+/+ HSPCs]; °°°p ≤ 0.001 [Atm−/− vs. Atm+/+ populations]). (C) Representative example of CFSE dilution assay in unirradiated (grey) or 2Gy-irradiated (color) cells grown for up to 3 days in liquid media (n = 4). (D) Intracellular cleaved caspase 3 staining in unirradiated (grey) or 2Gy-irradiated WT (left side; solid colors; n = 10) or H2k-bcl2 (right side; striped colors; n = 3) cells grown for up to 2 days in liquid media (p ≤ 0.001, *p ≤ 0.05 [unirradiated vs. irradiated cells]; °°°p ≤ 0.001, °p ≤ 0.05 [H2k-bcl2 vs. WT cells]; ns: not significant). (E) QRT-PCR analysis of the basal expression level of bcl2-family pro-survival and pro-apoptotic genes, Trp53 and p21 in freshly isolated cells. Results are expressed as log2 fold expression compared to levels measured in HSPCs (n = 6; ***p ≤ 0.001, **p ≤ 0.01, *p ≤ 0.05 [CMPs vs. HSPCs]; °°°p ≤ 0.001, °°p ≤ 0.01, °p ≤ 0.05 [GMPs vs. HSPCs]). (F) Western blot analysis of Mcl-1 and Bid protein levels in purified cells (protein extracted from 35,000 isolated cells per lane; β-actin is used as loading control). See also Figure S1.
Figure 2
Figure 2. Dual role for p53-mediated DNA damage response in HSPCs and myeloid progenitors
(A) Intracellular FACS analysis of p53 and actin protein levels in unirradiated (-IR) or 2Gy irradiated (+IR) mice 12 hours after exposure. (B) QRT-PCR analysis of p53 target genes in WT cells 8 and 12 hours after 2Gy IR treatment. Results are expressed as log2 fold expression compared to levels measured in unirradiated cells cultured in the same conditions (n = 3; ***p ≤ 0.001, **p ≤ 0.01, *p ≤ 0.05) or 12 hours (n = 3; °°°p ≤ 0.001, °°p ≤ 0.01, °p ≤ 0.05). (C) Clonogenic survival assay of irradiated Trp53−/− cells in methylcellulose (n = 3; **p ≤ 0.01, *p ≤ 0.05 [Trp53−/− vs. Trp53+/+ cells]). (D) Example of CFSE dilution assay in unirradiated (-IR: grey) or 2Gy-irradiated (+IR: blue) Trp53+/+ (solid) and Trp53−/− (striped) HSPCs grown for 2 days in liquid media (n = 3). (E) Intracellular cleaved caspase 3 staining in unirradiated (grey) or 2Gy-irradiated Trp53+/+ (solid colors) and Trp53−/− (striped colors) cells grown for up to 2 days in liquid media (n = 3; ***p ≤ 0.001, ** p ≤ 0.01, *p ≤ 0.05 [unirradiated vs. irradiated cells]; °°p ≤ 0.01, °p ≤ 0.05 [Trp53−/− vs. Trp53+/+ cells]; ns: not significant). (F) QRT-PCR analysis of p53-target genes in Trp53−/− cells 12 hours after 2Gy IR treatment. Results are expressed as log2 fold expression compared to levels measured in unirradiated Trp53−/− cells cultured in the same conditions (n = 3). See also Figure S2
Figure 3
Figure 3. Ongoing DNA repair in HSPCs versus cell elimination in myeloid progenitors
(A) Immunofluorescence microscopy of ionizing radiation-induced foci (IRIF) of γH2AX in unirradiated or 2Gy-irradiated HSPCs (n = 13), CMPs (n = 8) and GMPs (n = 10). The percentage of positive cells (≥6 γH2AX positive foci) is shown over 24 hours (*p ≤ 0.05 [CMPs vs. HSPCs]; °°°p ≤ 0.001 [GMPs vs. HSPCs]; scale bar = 10 μm). (B) Representative examples of COMET tail DNA content scoring from un-damaged (0), increasingly damaged (1–3) to very damaged (4) cells. (C) Quantification of tail DNA content scores in unirradiated or 2Gy irradiated HSPCs, CMPs and GMPs after 2 and 24 hours. Results are normalized to the number of cells counted per field (n = 3; **p ≤ 0.01). See also Table S1.
Figure 4
Figure 4. High NHEJ-mediated DNA repair mechanism in HSPCs
(A) Immunofluorescence microscopy of Rad51 IRIF in unirradiated and 2Gy-irradiated HSPCs (n = 5), CMPs (n = 6) and GMPs (n = 8). The percentage of positive cells (≥3 Rad51 positive foci) is shown over 24 hours (***p ≤ 0.001, **p ≤ 0.01, *p ≤ 0.05 [CMPs vs. HSPCs]; °°°p ≤ 0.001, °p ≤ 0.05 [GMPs vs. HSPCs]; scale bar = 10 μm). (B) Immunofluorescence microscopy of 53BP1 IRIF in unirradiated and 2Gy-irradiated HSPCs (n = 9), CMPs (n = 7) and GMPs (n = 9). The percentage of positive cells (≥3 53BP1 positive foci) is shown over 24 hours (***p ≤ 0.001, *p ≤ 0.05 [CMPs vs. HSPCs]; °°°p ≤ 0.001, °°p ≤ 0.01 [GMPs vs. HSPCs]; scale bar = 10 μm). (C) QRT-PCR analysis of homologous recombination (HR) and nonhomologous end joining (NHEJ) DNA repair genes in freshly isolated cells. Results are expressed as log2 fold expression compared to levels measured in HSPCs (n = 3; ***p ≤ 0.001, *p ≤ 0.05 [CMPs vs. HSPCs]; °°°p ≤ 0.001, °°p ≤ 0.01, °p ≤ 0.05 [GMPs vs. HSPCs]). (D) Quantification of NHEJ activity in unirradiated and 2Gy-irradiated cells. Results are expressed as fold changes upon IR-treatment (n = 5; ***p ≤ 0.001, **p ≤ 0.01). See also Figure S3 and Figure S4.
Figure 5
Figure 5. Similar radioresistance in quiescent and proliferating HSPCs
(A) In vitro 24 hour pre-culture (24hr preC) and in vivo cyclosphosphamide/G-CSF mobilization (Mob.) strategies used to induce proliferation of quiescent (Rest.) HSPCs. (B) Proliferation rates measured after 1 hour BrdU pulse in vitro (n = 3; •••p ≤ 0.001; [proliferating HSPCs vs. resting HSPCs]). (C) Quiescence status measured by intracellular 7AAD/Pyronin Y staining. (D) Clonogenic survival assay in methylcellulose (n = 3). (E) Growth in liquid media (n = 3). (G) Intracellular cleaved caspase 3 staining in unirradiated (grey) or 2Gy-irradiated (color) resting and proliferating HSPCs grown for up to 2 days in liquid media (n = 3; ***p ≤ 0.001, **p ≤ 0.01, *p ≤ 0.05 [proliferating HSPCs ± IR vs. resting HSPCs ± IR]; ns: not significant). (F) Example of CFSE dilution assay in unirradiated (grey) or 2Gy-irradiated (color) quiescent and proliferating HSPCs grown for 2 days in liquid media (n = 3). See also Figure S5.
Figure 6
Figure 6. Proliferating HSPCs shift to HR-mediated DNA repair mechanism
(A) Immunofluorescence microscopy of Rad51 IRIF in 2Gy-irradiated resting HSPCs (n = 5), 24h pre-cultured HSPCs (n = 3) and mobilized HSPCs (n = 5). The percentage of positive cells (≥ 3 Rad51 positive foci) is shown over 24 hours (***p ≤ 0.001, *p ≤ 0.05 [24h preC. vs. Rest. HSPCs]; °°°p ≤ 0.001 [Mob. vs. Rest. HSPCs]; scale bar = 10 μm). (B) Immunofluorescence microscopy of 53BP1 IRIF in 2Gy-irradiated resting HSPCs (n = 9), 24h pre-cultured HSPCs (n = 3) and mobilized HSPCs (n = 5). The percentage of positive cells (≥ 3 53BP1 positive foci) is shown over 24 hours (***p ≤ 0.001 [24hr preC. vs. Rest. HSPCs]; °°°p ≤ 0.001, °°p ≤ 0.01 [Mob. vs. Rest. HSPCs]; scale bar = 10 μm). (C) QRT-PCR analysis of HR and NHEJ repair genes in resting and proliferating HSPCs (n = 3; ***p ≤ 0.001, **p ≤ 0.01, *p ≤ 0.05 [24h preC vs. Rest. HSPCs]; °°°p ≤ 0.001, °°p ≤ 0.01, °p ≤ 0.05 [Mob. vs. Rest. HSPCs]). (D) Quantification of NHEJ activity in unirradiated and 2Gy-irradiated resting and proliferating HSPCs. Results are average ± SEM (error bars) of 2 (24h preC. and Mob. HSPCs) to 5 (Rest. HSPCs) independent experiments and are expressed as fold changes upon IR-treatment (*p 0.05). See also Figure S4 and Figure S5.
Figure 7
Figure 7. Mutagenic DNA repair in quiescent HSPCs
(A) Summary of the SKY analyses performed on the in vitro progeny of 2Gy-irradiated quiescent HSPCs. (B) Average number of genomic rearrangement (left side) and percentage (%) of aberrant cells (right side) identified by SKY analysis in the in vitro progeny of 2Gy-irradiated quiescent (Rest.; n = 4) and proliferating (Mob./24h preC; n = 3) HSPCs (*p ≤ 0.05). (C) Experimental design of the in vivo analysis of 2Gy-irradiated HSPCs assessing long-term reconstitution and genomic instability. (D) Summary of the SKY analysis performed on the in vivo MP progeny of 2Gy-irradiated quiescent HSPCs 4 months after transplantation. (E) In cohort I2, 1,500 ±IR HSPC together with 300,000 Sca-1-depleted helper bone marrow cells were transplanted per recipient (n = 5 [0Gy] and 4 [2Gy] mice per group). Long-term reconstitution was measured by sustained CD45.1 chimerism in the peripheral blood of primary transplanted mice (left graph; expressed as percent of the engraftment provided by unirradiated HSPCs) and secondary transplantation of donor-derived HSPCs re-isolated from pooled primary transplanted animals (right graph; expressed as engraftment ratio of CD45.1+ cells at 4 months post-transplantation; n = 4 [0Gy] and 5 [2Gy] mice per group). See also Figure S6, Table S2 and Table S3.

Comment in

Similar articles

Cited by

References

    1. Abbas T, Dutta A. p21 in cancer: intricate networks and multiple activities. Nat Rev Cancer. 2009;9:400–414. - PMC - PubMed
    1. Allan JM, Travis LB. Mechanisms of therapy-related carcinogenesis. Nat Rev Cancer. 2005;5:943–955. - PubMed
    1. Bonnet D, Dick JE. Human acute myeloid leukemia is organized as a hierarchy that originates from a primitive hematopoietic cell. Nat Med. 1997;3:730–737. - PubMed
    1. Chambers SM, Goodell MA. Hematopoietic stem cell aging: wrinkles in stem cell potential. Stem Cell Rev. 2007;3:201–211. - PubMed
    1. Dodson H, Bourke E, Jeffers LJ, Vagnarelli P, Sonoda E, Takeda S, Earnshaw WC, Merdes A, Morrison C. Centrosome amplification induced by DNA damage occurs during a prolonged G2 phase and involves ATM. EMBO J. 2004;23:3864–3873. - PMC - PubMed

Publication types

MeSH terms

Substances