

General multivariate linear modeling of surface shapes using SurfStat
- PMID: 20620211
- PMCID: PMC3056984
- DOI: 10.1016/j.neuroimage.2010.06.032
General multivariate linear modeling of surface shapes using SurfStat
Abstract
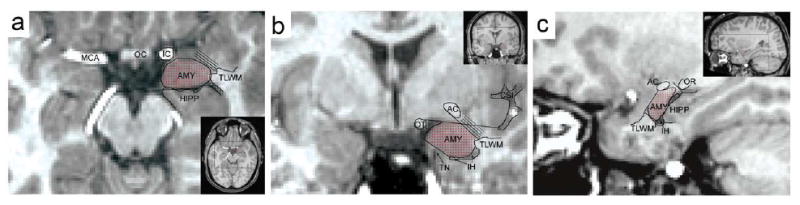
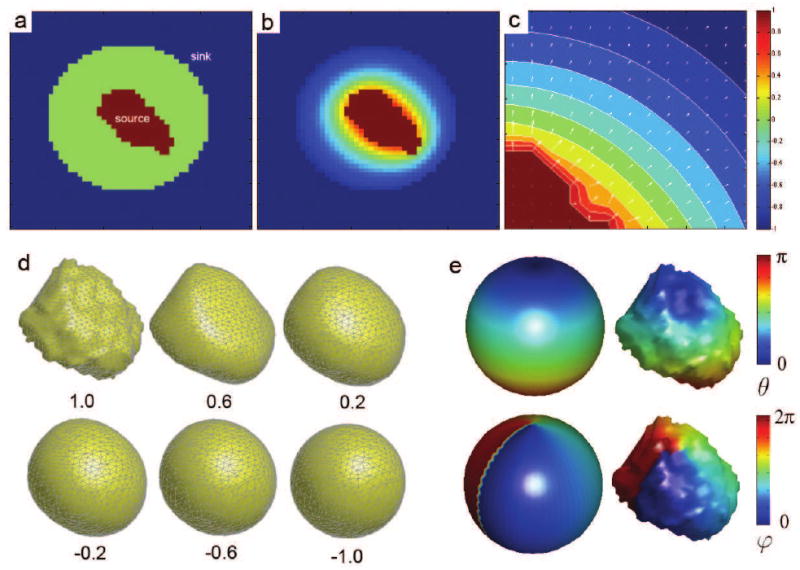
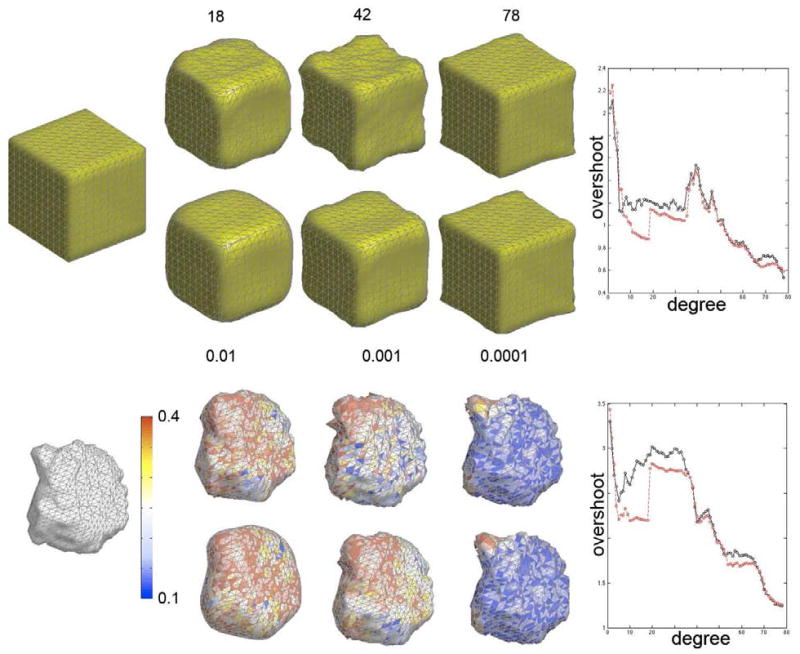
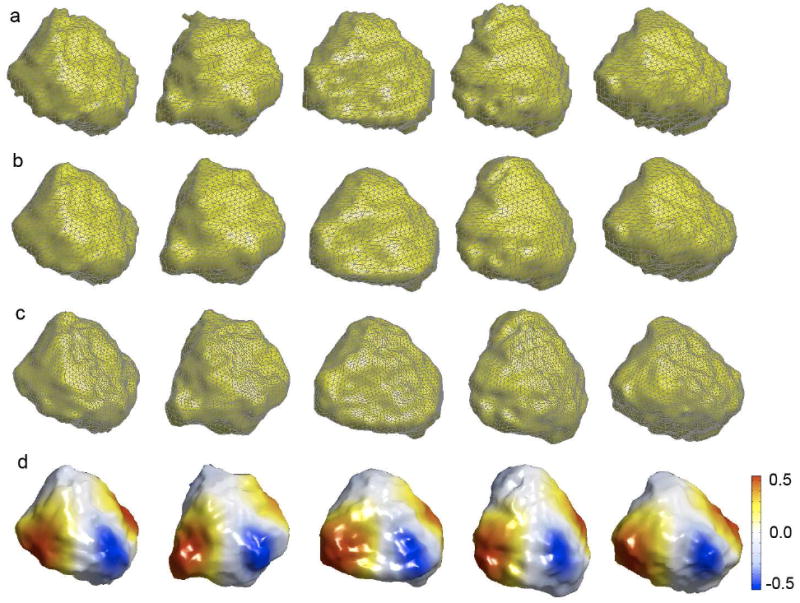
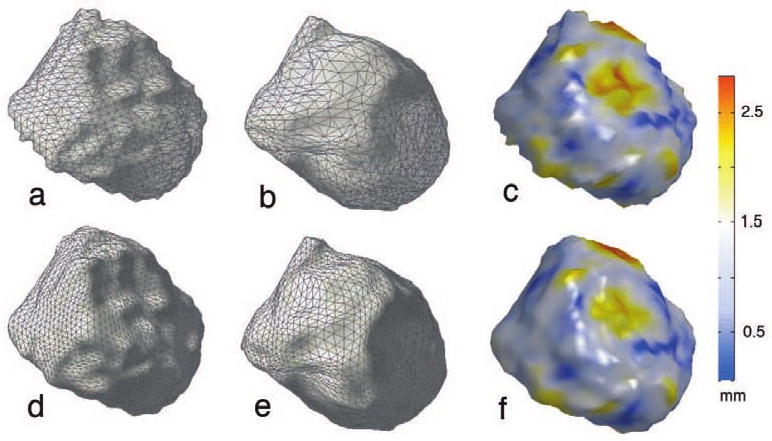
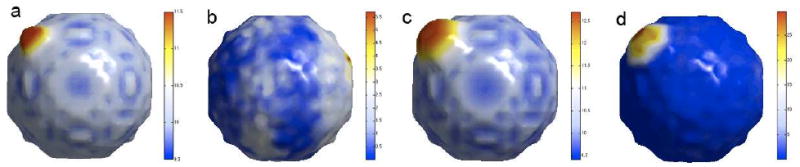
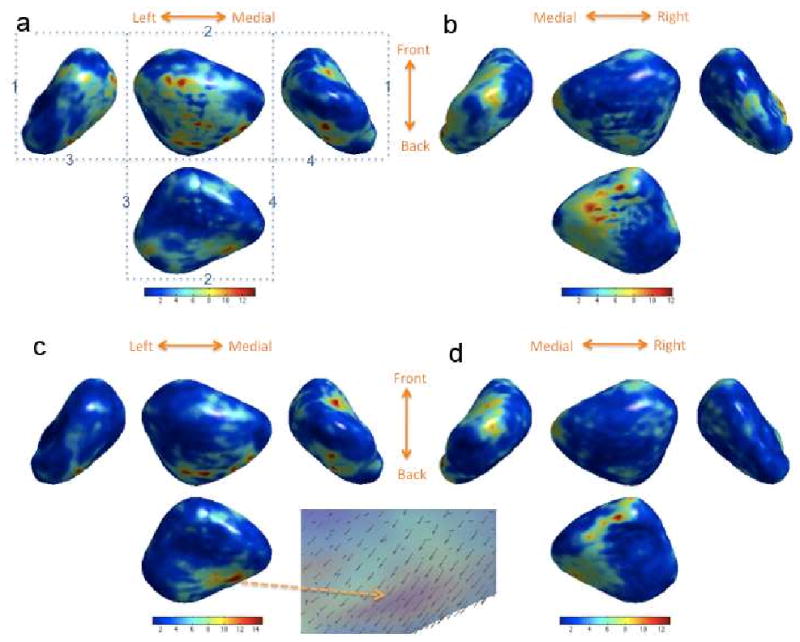
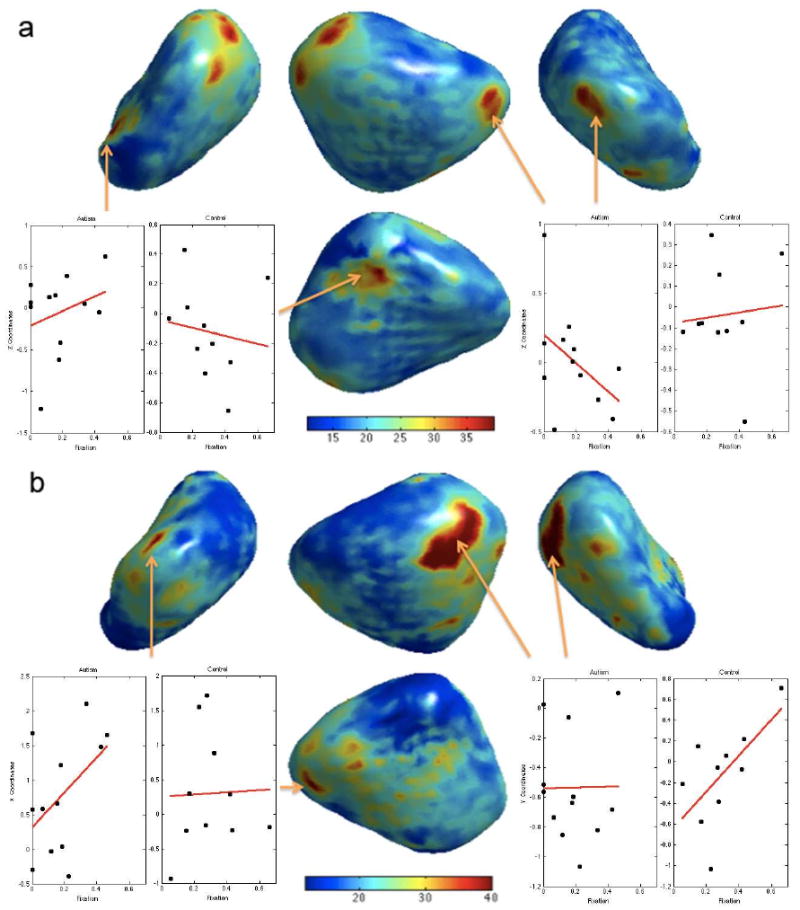
Although there are many imaging studies on traditional ROI-based amygdala volumetry, there are very few studies on modeling amygdala shape variations. This paper presents a unified computational and statistical framework for modeling amygdala shape variations in a clinical population. The weighted spherical harmonic representation is used to parameterize, smooth out, and normalize amygdala surfaces. The representation is subsequently used as an input for multivariate linear models accounting for nuisance covariates such as age and brain size difference using the SurfStat package that completely avoids the complexity of specifying design matrices. The methodology has been applied for quantifying abnormal local amygdala shape variations in 22 high functioning autistic subjects.
Copyright 2010 Elsevier Inc. All rights reserved.
Figures
Similar articles
-
Tensor-based cortical surface morphometry via weighted spherical harmonic representation.IEEE Trans Med Imaging. 2008 Aug;27(8):1143-51. doi: 10.1109/TMI.2008.918338. IEEE Trans Med Imaging. 2008. PMID: 18672431
-
Weighted fourier series representation and its application to quantifying the amount of gray matter.IEEE Trans Med Imaging. 2007 Apr;26(4):566-81. doi: 10.1109/TMI.2007.892519. IEEE Trans Med Imaging. 2007. PMID: 17427743
-
Three-dimensional volumetric analysis and reconstruction of amygdala and hippocampal head, body and tail.Psychiatry Res. 2007 Jul 15;155(2):155-65. doi: 10.1016/j.pscychresns.2006.11.011. Epub 2007 May 9. Psychiatry Res. 2007. PMID: 17493789
-
Computational anatomy with the SPM software.Magn Reson Imaging. 2009 Oct;27(8):1163-74. doi: 10.1016/j.mri.2009.01.006. Epub 2009 Feb 27. Magn Reson Imaging. 2009. PMID: 19249168 Review.
-
Regional deficits in brain volume in schizophrenia: a meta-analysis of voxel-based morphometry studies.Am J Psychiatry. 2005 Dec;162(12):2233-45. doi: 10.1176/appi.ajp.162.12.2233. Am J Psychiatry. 2005. PMID: 16330585 Review.
Cited by
-
Surface-based morphological patterns associated with neuropsychological performance, symptom severity, and treatment response in Parkinson's disease.Ann Transl Med. 2022 Jul;10(13):741. doi: 10.21037/atm-22-630. Ann Transl Med. 2022. PMID: 35957730 Free PMC article.
-
4D hyperspherical harmonic (HyperSPHARM) representation of multiple disconnected brain subcortical structures.Med Image Comput Comput Assist Interv. 2013;16(Pt 1):598-605. doi: 10.1007/978-3-642-40811-3_75. Med Image Comput Comput Assist Interv. 2013. PMID: 24505716 Free PMC article.
-
Cumulative Blood Pressure Exposure, Basal Ganglia, and Thalamic Morphology in Midlife.Hypertension. 2020 May;75(5):1289-1295. doi: 10.1161/HYPERTENSIONAHA.120.14678. Epub 2020 Mar 30. Hypertension. 2020. PMID: 32223376 Free PMC article.
-
4D hyperspherical harmonic (HyperSPHARM) representation of surface anatomy: a holistic treatment of multiple disconnected anatomical structures.Med Image Anal. 2015 May;22(1):89-101. doi: 10.1016/j.media.2015.02.004. Epub 2015 Mar 9. Med Image Anal. 2015. PMID: 25828650 Free PMC article.
-
3D time series analysis of cell shape using Laplacian approaches.BMC Bioinformatics. 2013 Oct 4;14:296. doi: 10.1186/1471-2105-14-296. BMC Bioinformatics. 2013. PMID: 24090312 Free PMC article.
References
-
- Anderson T. An Introduction to Multivariate Statistical Analysis. 2nd Wiley; 1984.
-
- Angenent S, Hacker S, Tannenbaum A, Kikinis R. On the laplace-beltrami operator and brain surface flattening. IEEE Transactions on Medical Imaging. 1999;18:700–711. - PubMed
-
- Aylward E, Minshew N, Goldstein G, Honeycutt N, Augustine A, Yates K, Bartra P, Pearlson G. Mri volumes of amygdala and hippocampus in nonmentally retarded autistic adolescents and adults. Neurology. 1999;53:2145–2150. - PubMed
-
- Barnea-Goraly N, Kwon H, Menon V, Eliez S, Lotspeich L, Reiss A. White matter structure in autism: preliminary evidence from diffusion tensor imaging. Biological Psychiatry. 2004;55:323–326. - PubMed
Publication types
MeSH terms
Grants and funding
LinkOut - more resources
Full Text Sources
Medical
