Multimodal imaging of repetition priming: Using fMRI, MEG, and intracranial EEG to reveal spatiotemporal profiles of word processing
- PMID: 20620212
- PMCID: PMC2930128
- DOI: 10.1016/j.neuroimage.2010.06.069
Multimodal imaging of repetition priming: Using fMRI, MEG, and intracranial EEG to reveal spatiotemporal profiles of word processing
Abstract
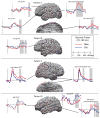
Repetition priming is a core feature of memory processing whose anatomical correlates remain poorly understood. In this study, we use advanced multimodal imaging (functional magnetic resonance imaging (fMRI) and magnetoencephalography; MEG) to investigate the spatiotemporal profile of repetition priming. We use intracranial electroencephalography (iEEG) to validate our fMRI/MEG measurements. Twelve controls completed a semantic judgment task with fMRI and MEG that included words presented once (new, 'N') and words that repeated (old, 'O'). Six patients with epilepsy completed the same task during iEEG recordings. Blood-oxygen level dependent (BOLD) responses for N vs. O words were examined across the cortical surface and within regions of interest. MEG waveforms for N vs. O words were estimated using a noise-normalized minimum norm solution, and used to interpret the timecourse of fMRI. Spatial concordance was observed between fMRI and MEG repetition effects from 350 to 450 ms within bilateral occipitotemporal and medial temporal, left prefrontal, and left posterior temporal cortex. Additionally, MEG revealed widespread sources within left temporoparietal regions, whereas fMRI revealed bilateral reductions in occipitotemporal and left superior frontal, and increases in inferior parietal, precuneus, and dorsolateral prefrontal activity. BOLD suppression in left posterior temporal, left inferior prefrontal, and right occipitotemporal cortex correlated with MEG repetition-related reductions. IEEG responses from all three regions supported the timecourse of MEG and localization of fMRI. Furthermore, iEEG decreases to repeated words were associated with decreased gamma power in several regions, providing evidence that gamma oscillations are tightly coupled to cognitive phenomena and reflect regional activations seen in the BOLD signal.
Copyright 2010 Elsevier Inc. All rights reserved.
Figures


References
-
- Allison T, Puce A, Spencer DD, McCarthy G. Electrophysiological studies of human face perception. I: Potentials generated in occipitotemporal cortex by face and non-face stimuli. Cereb Cortex. 1999;9:415–430. - PubMed
-
- Dalal SS, Baillet S, Adam C, Ducorps A, Schwartz D, Jerbi K, Bertrand O, Garnero L, Martinerie J, Lachaux JP. Simultaneous MEG and intracranial EEG recordings during attentive reading. Neuroimage. 2009;45:1289–1304. - PubMed
-
- Dale AM, Fischl B, Sereno MI. Cortical surface-based analysis. I. Segmentation and surface reconstruction. Neuroimage. 1999;9:179–194. - PubMed
-
- Dale AM, Halgren E. Spatiotemporal mapping of brain activity by integration of multiple imaging modalities. Curr Opin Neurobiol. 2001;11:202–208. - PubMed
Publication types
MeSH terms
Grants and funding
LinkOut - more resources
Full Text Sources

