

Longitudinal MRI atrophy biomarkers: relationship to conversion in the ADNI cohort
- PMID: 20620664
- PMCID: PMC2904350
- DOI: 10.1016/j.neurobiolaging.2010.04.029
Longitudinal MRI atrophy biomarkers: relationship to conversion in the ADNI cohort
Abstract
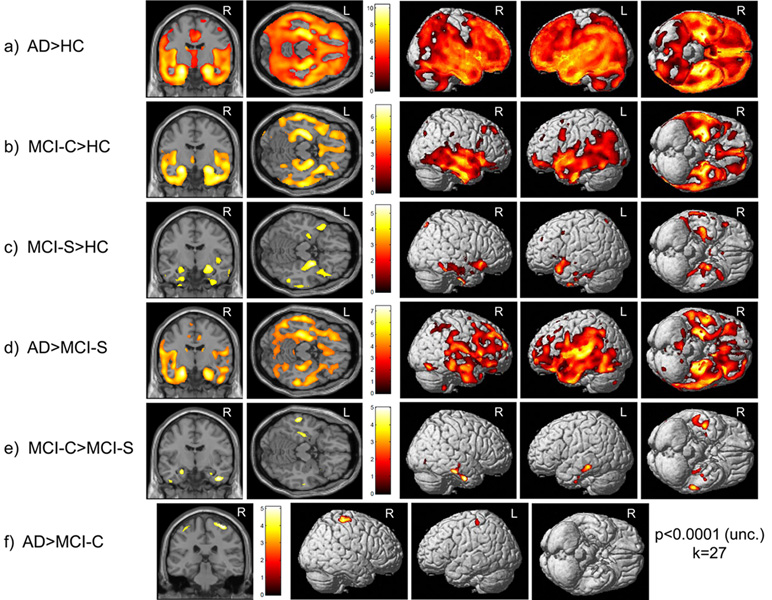
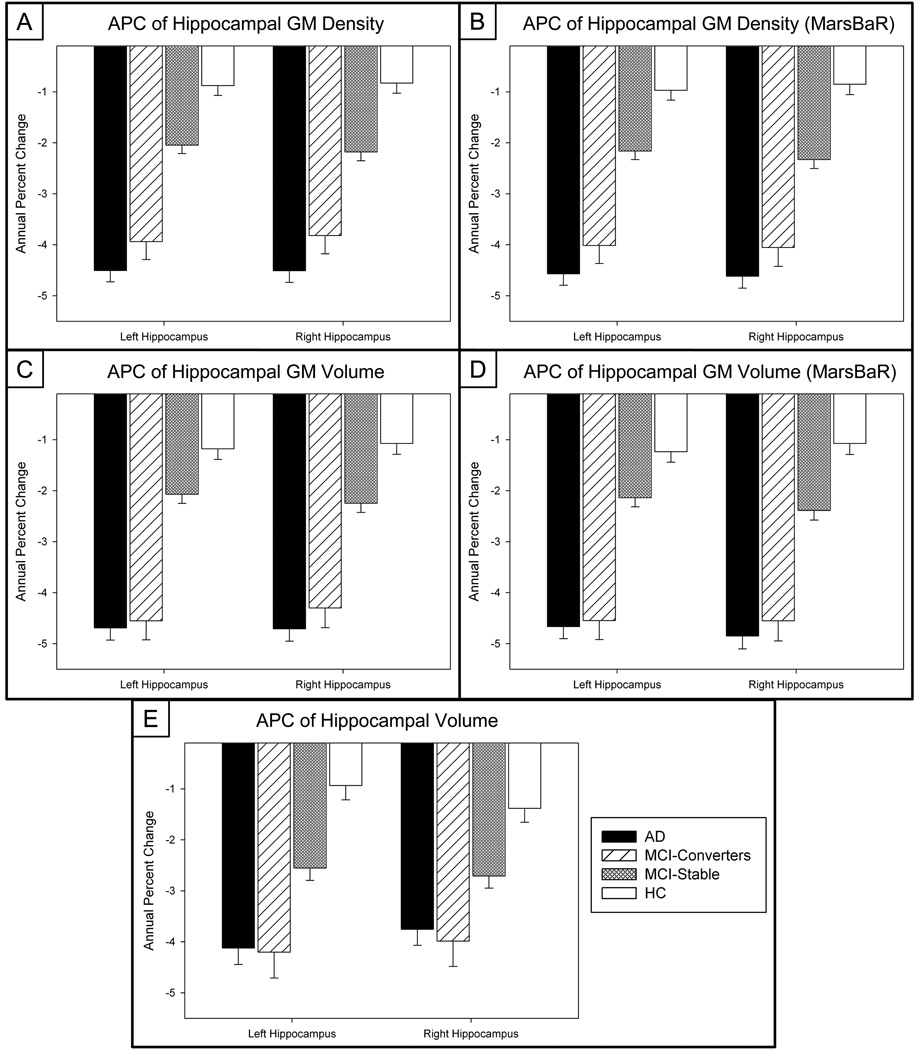
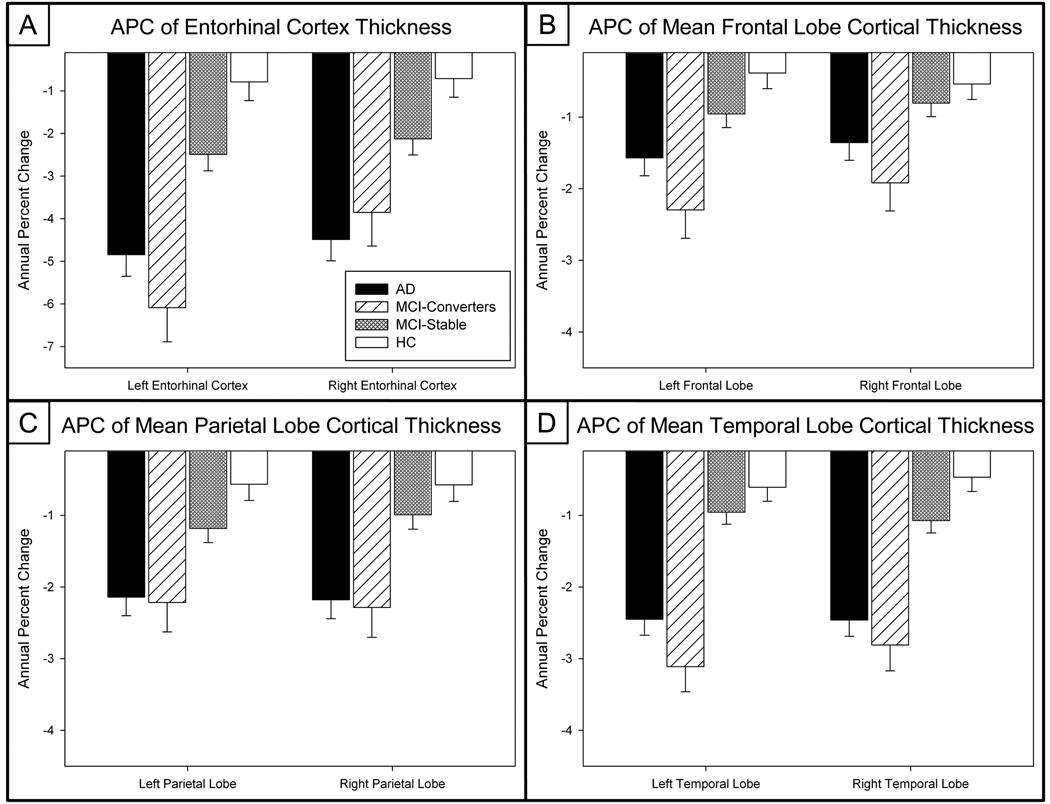
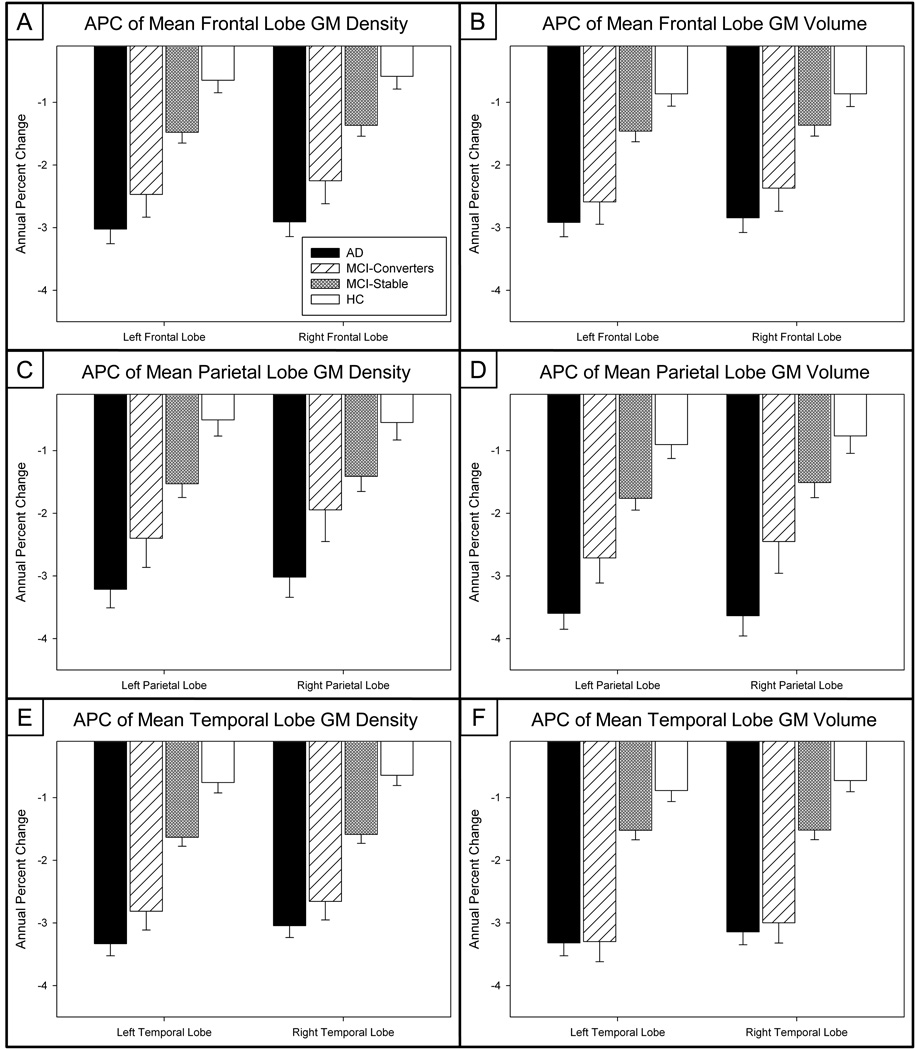
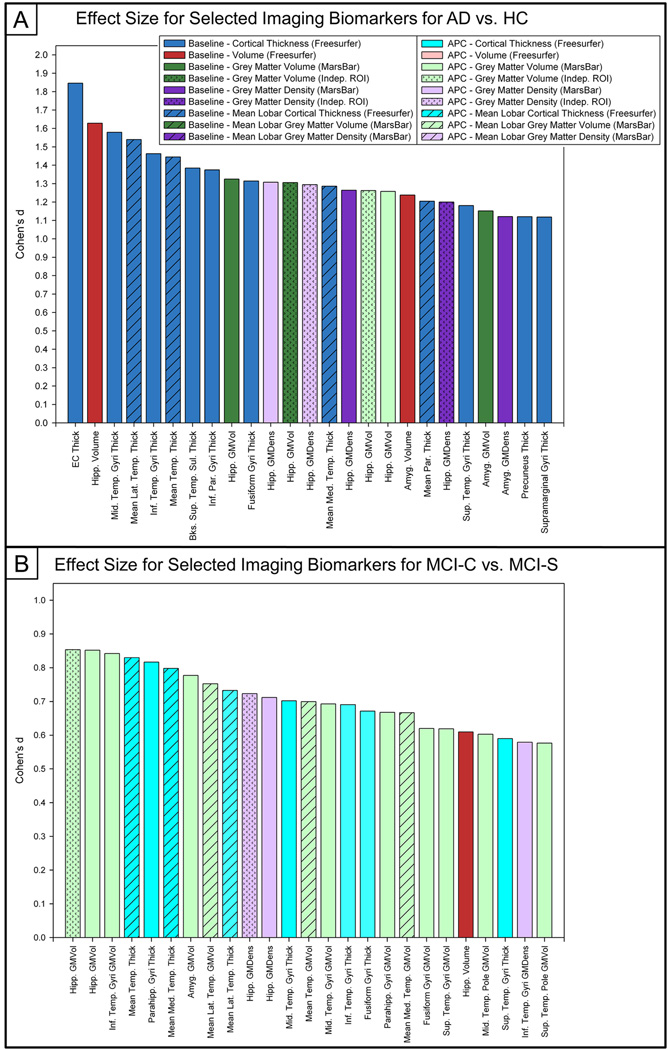
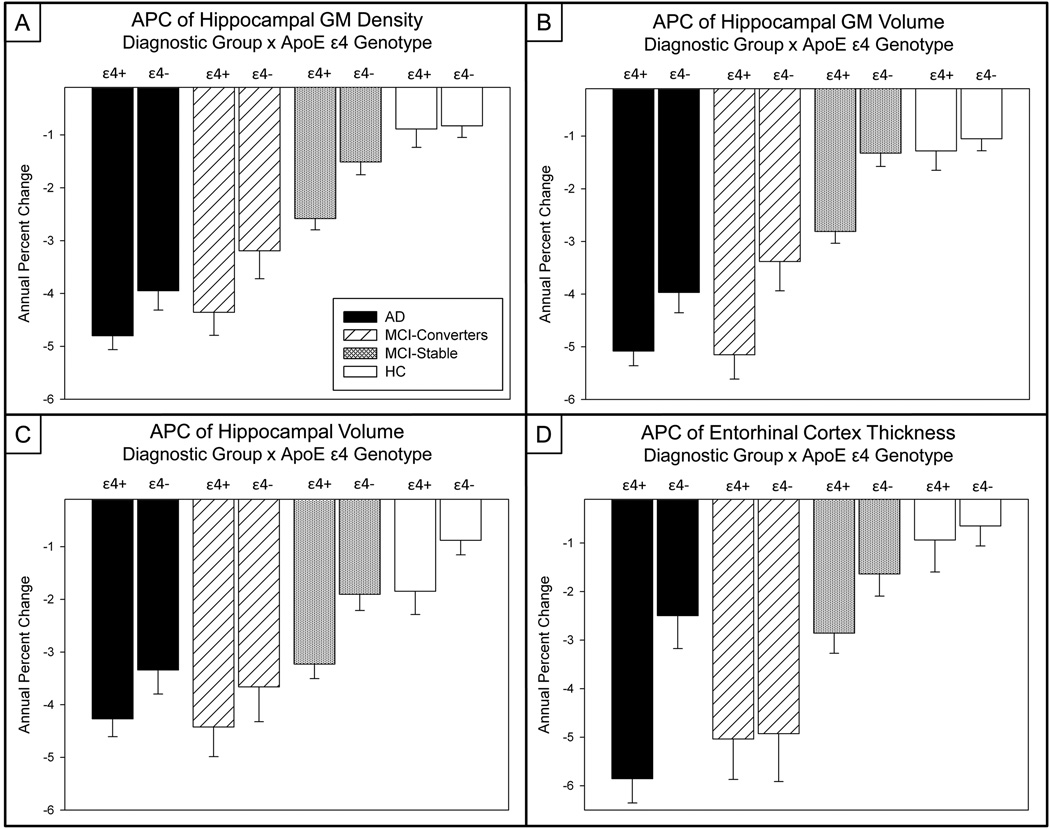
Atrophic changes in early Alzheimer's disease (AD) and amnestic mild cognitive impairment (MCI) have been proposed as biomarkers for detection and monitoring. We analyzed magnetic resonance imaging (MRI) atrophy rate from baseline to 1 year in 4 groups of participants from the Alzheimer's Disease Neuroimaging Initiative (ADNI): AD (n = 152), converters from MCI to probable AD (MCI-C, n = 60), stable MCI (MCI-S, n = 261), and healthy controls (HC, n = 200). Scans were analyzed using multiple methods, including voxel-based morphometry (VBM), regions of interest (ROIs), and automated parcellation, permitting comparison of annual percent change (APC) in neurodegeneration markers. Effect sizes and the sample required to detect 25% reduction in atrophy rates were calculated. The influence of APOE genotype on APC was also evaluated. AD patients and converters from MCI to probable AD demonstrated high atrophy APCs across regions compared with minimal change in healthy controls. Stable MCI subjects showed intermediate atrophy rates. APOE genotype was associated with APC in key regions. In sum, APC rates are influenced by APOE genotype, imminent MCI to AD conversion, and AD-related neurodegeneration.
2010 Elsevier Inc. All rights reserved.
Figures
References
-
- Apostolova L, Dutton R, Dinov I, Hayashi K, Toga A, Cummings J, Thompson P. Conversion of mild cognitive impairment to Alzheimer disease predicted by hippocampal atrophy maps. Arch Neurol. 2006;63(5):693–699. - PubMed
-
- Ashburner J, Friston KJ. Voxel-based morphometry--the methods. Neuroimage. 2000;11(6 Pt 1):805–821. - PubMed
-
- Barnes J, Boyes RG, Lewis EB, Schott JM, Frost C, Scahill RI, Fox NC. Automatic calculation of hippocampal atrophy rates using a hippocampal template and the boundary shift integral. Neurobiol Aging. 2007;28(11):1657–1663. - PubMed
-
- Becker JT, Davis SW, Hayashi KM, Meltzer CC, Toga AW, Lopez OL, Thompson PM. Three-dimensional patterns of hippocampal atrophy in mild cognitive impairment. Arch Neurol. 2006;63(1):97–101. - PubMed
Publication types
MeSH terms
Substances
Grants and funding
- K01 AG030514/AG/NIA NIH HHS/United States
- R01 AG019771/AG/NIA NIH HHS/United States
- U01 AG032984/AG/NIA NIH HHS/United States
- RC2 AG036535/AG/NIA NIH HHS/United States
- P30 AG10133-18S1/AG/NIA NIH HHS/United States
- R01 AG19771/AG/NIA NIH HHS/United States
- R01 CA101318/CA/NCI NIH HHS/United States
- P30 AG010129/AG/NIA NIH HHS/United States
- P30 AG010133/AG/NIA NIH HHS/United States
- U24 AG021886/AG/NIA NIH HHS/United States
- R03 EB008674/EB/NIBIB NIH HHS/United States
- U01 AG024904/AG/NIA NIH HHS/United States
- U19 AG010483/AG/NIA NIH HHS/United States
LinkOut - more resources
Full Text Sources
Other Literature Sources
Medical
Miscellaneous
