. 2010 Jun 24;66(6):871-83.
doi: 10.1016/j.neuron.2010.05.009.

An epilepsy/dyskinesia-associated mutation enhances BK channel activation by potentiating Ca2+ sensing

Affiliations

An epilepsy/dyskinesia-associated mutation enhances BK channel activation by potentiating Ca2+ sensing

Junqiu Yang et al. Neuron. .

Abstract

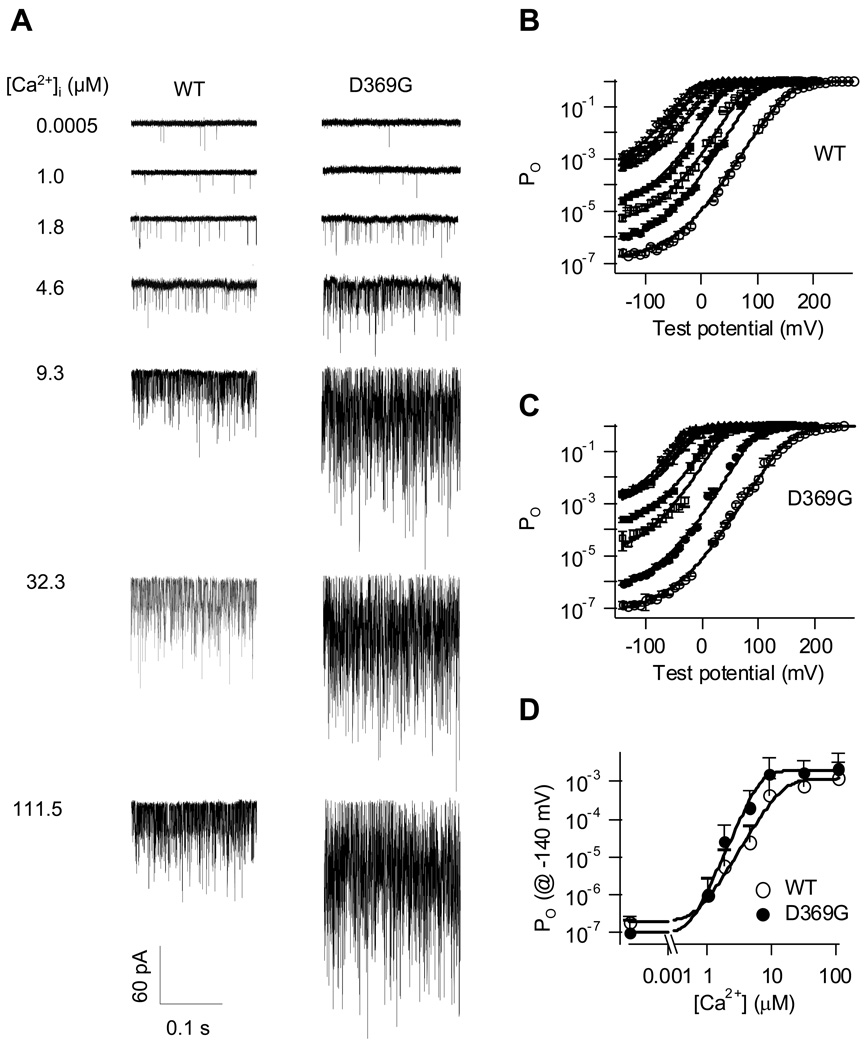
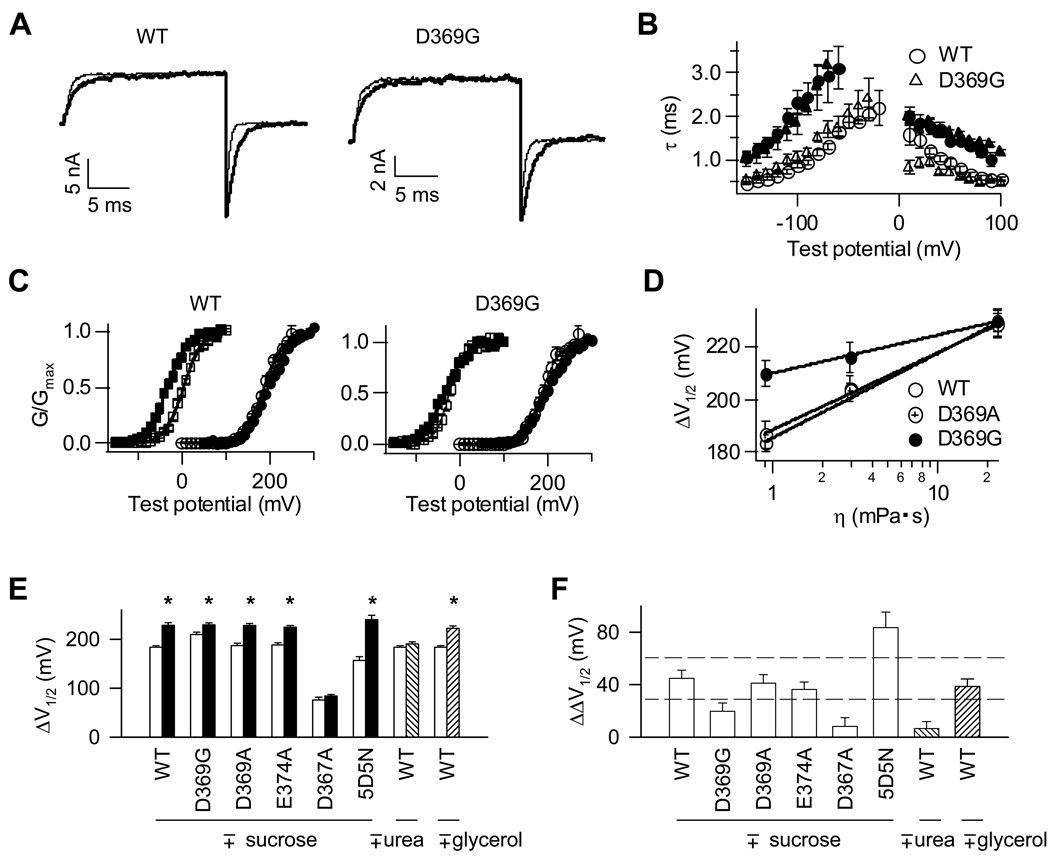
Ca(2+)-activated BK channels modulate neuronal activities, including spike frequency adaptation and synaptic transmission. Previous studies found that Ca(2+)-binding sites and the activation gate are spatially separated in the channel protein, but the mechanism by which Ca(2+) binding opens the gate over this distance remains unknown. By studying an Asp-to-Gly mutation (D434G) associated with human syndrome of generalized epilepsy and paroxysmal dyskinesia (GEPD), we show that a cytosolic motif immediately following the activation gate S6 helix, known as the AC region, mediates the allosteric coupling between Ca(2+) binding and channel opening. The GEPD mutation inside the AC region increases BK channel activity by enhancing this allosteric coupling. We found that Ca(2+) sensitivity is enhanced by increases in solution viscosity that reduce protein dynamics. The GEPD mutation alters such a response, suggesting that a less flexible AC region may be more effective in coupling Ca(2+) binding to channel opening.


Figures

Figure 1
Figure 1. The epilepsy/dyskinesia mutation mD369G enhances Ca2+ sensitivity of mSlo1 BK channel activation
(A) The Slo1 polypeptide. The membrane-spanning domain contains helices S0-S6 and pore loop (P), of which S1-S4 form the voltage sensor domain (VSD) and S5-S6 form the pore/gate domain (PGD). The cytoplasmic domain contains two putative Ca2+ binding sites: the D367 site (Site I) and the Ca2+ bowl (Site II). mD369G is located in the AC region, close to the D367 Ca2+ binding site. (B) Macroscopic current traces from inside-out patches expressing WT and mD369G channels. Currents were elicited in 1.8 µM [Ca2+]i by voltages as indicated. The voltages before and after the pulses were −50 mV. (C and D) G–V curves for WT and mD369G channels in [Ca2+]i from nominal 0 (~0.5 nM) to 111.5 µM. Solid lines are fits with the MWC model (see Methods). (E) V1/2 of G–V curves versus [Ca2+]i for WT and mD369G channels. (F) Parameters of MWC model fits for WT and mD369G channels (value ± standard deviation).
Figure 2
Figure 2. mD369G enhances Ca2+ sensitivity as shown by limiting slope measurement
(A) Current traces at −140 mV under different [Ca2+]i for WT and mD369G. The patch for WT has ~ 730 channels, and the one for mD369G has ~ 550 channels. [Ca2+]i is labelled next to the corresponding traces. (B and C) Po-V relations for WT (B) and mD369G (C) under different [Ca2+]i. The symbols for each [Ca2+]i are identical to Figure 1C and D. Solid lines are fittings to the HCA model. (D) Po at −140 mV under different [Ca2+]i for WT and mD369G. Solid lines are fittings to the Hill equation: Po = 1/(1+(KA/[Ca2+])n). The microscopic dissociation constant KA = 15 and 8 µM and the Hill coefficient n = 2.8 and 3.5 for WT and mD369G, respectively.
Figure 3
Figure 3. mD369G mutation specifically affects the D367-associated Ca2+ activation pathway
(A) Diagram illustrating the relationship between Ca2+ binding sites and the gate. Ca2+ binding to the two sites, which are located distant from the activation gate, activates the channel through independent pathways with little cooperativity. mD369G is located close to the D367 site. (B and D) G–V curves for D367A and D367A/D369G mutants (B), and for 5D5N and 5D5N/D369G mutants (D) with 0 and 32.3 µM [Ca2+]i. Solid lines are fits with the Boltzmann function. (C and E) V1/2 versus [Ca2+]i for D367A and D367A/D369G mutants (C), and for 5D5N and 5D5N/D369G mutants (E). The curves for D367A and D367A/D369G are shifted vertically to align at 0 [Ca2+]i in the inset of (C). (F) V1/2 versus [Ca2+]i for WT and D369A, E, G, N, P, and W mutants. Note that the data in this panel were obtained in a different batch of experiments with a different set of Ca2+ solutions, hence the final Ca2+ concentrations are slightly different from those in other figures.
Figure 4
Figure 4. mD369G mutation alters response of BK channels to solution viscosity
(A) Macroscopic current traces recorded in the absence (thinner traces) or presence (thicker traces) of 2M sucrose. Currents were elicited in saturating 200 µM [Ca2+]i by 70 mV. Holding and repolarizing voltages were −80 and −120 mV, respectively. Current traces with sucrose were re-scaled to have the same peak amplitude as without sucrose. (B) Activation (> 0 mV) and deactivation (< 0 mV) time constant in the absence (hollow symbols) or presence (solid symbols) of 2 M sucrose. [Ca2+]i = 200 µM. Channels were activated by 70 mV then deactivated by various voltages to obtain deactivation time constant. (C) G–V curves for WT and mD369G in the absence (hollow symbols) or presence (solid symbols) of 2 M sucrose. [Ca2+]i = 0 (circles) or 200 µM (squares). Solid lines are fits with the Boltzmann function. (D) ΔV1/2 versus viscosity. ΔV1/2 = V1/2 at 0 [Ca2+]i - V1/2 at 200 µM [Ca2+]i. The solutions contained 0, 1 and 2 M sucrose, respectively. Solid lines are fits with equation ΔV1/2 = ln(η/η0)γ, where η0 is the viscosity of zero ΔV1/2 and γ is the slope in the semi-log plot; γ = 13.7 ± 0.9 and 6.2 ± 0.5 (value ± standard deviation) for WT and mD369G, respectively. (E) ΔV1/2 in the absence (hollow bars) or presence (solid bars) of 2 M sucrose. Hatched bar indicates ΔV1/2 in the presence of 2 M urea or 9 M glycerol. Asterisks indicate a significant difference (p < 0.05 in student’s t test) of ΔV1/2 resulted from 2 M sucrose or 9 M glycerol. (F) ΔΔV1/2 caused by sucrose. ΔΔV1/2 = ΔV1/22 M sucrose - ΔV1/20 sucrose. Hatched bar indicates ΔΔV1/2 caused by 2 M urea or 9 M glycerol. The dashed lines give the 99% confidence interval for ΔΔV1/2 of WT.
Figure 5
Figure 5. Mutations in the AC region perturb the D367-associated Ca2+ activation pathway
(A) Effect of the AC region mutations on Ca2+ activation. The mutation scan includes H344 – A419 of mSlo1 (GenBank accession number, GI: 347143). The residues were individually mutated to Ala except that A389, A412 and A419 were mutated to Gly, Q397 to Cys, and E399 to Asn. ΔΔV1/2(ΔCa2+) = ΔV1/2WT - ΔV1/2Mutant, where ΔV1/2 = V1/2 at 99.3 to 111.5 µM [Ca2+]i - V1/2 at 0 [Ca2+]i. Mutations with ΔΔV1/2(ΔCa2+) falling beyond the ± 20 mV (dashed lines) interval significantly affect Ca2+ activation, which are (denoted by asterisks) F359A, D362A, L364A, H365A, D367A, R368A, L387A, F391A, T396A, and F400A. Open circles depict z values. The dotted line indicates the z value of WT. Structural motifs are indicated by horizontal thick lines. Arrows indicate mutations from which we were unable to obtain data because either the G–V curves at 0 [Ca2+]i shifted to extremely positive potentials beyond the range of measurement (S355A and K392A) or the mutant failed to express macroscopic currents (V398A). (B) V1/2 versus [Ca2+]i for the combined mutation in αA and αB on the background of Ca2+ bowl mutation 5D5N. (C) V1/2 versus [Ca2+]i for the combined mutation in αA, αB, and βC on the background of D367A mutation. The G–V curve at 0 [Ca2+]i for the combined mutation shifted to extremely positive potentials and hence the V1/2 is unavailable. The two curves are shifted vertically to align at 1.0 µM [Ca2+]i in the inset. (D) Effect of individual and combined mutations on Ca2+ activation (filled bars). Open bars depict the summed effects of individual mutations except for those under F359A/D362A/L387A/F391A and L387A/F391A/T396A/F400A, which show the summed effects of F359A, D362A, and L387A/F391A, and of L387A/F391A and T396A/F400A, respectively. Thick lines indicate the structural motifs where the mutations are located.
Figure 6
Figure 6. Mutations in the AC region allosterically alter the effect of mD369G mutation
(A–C) V1/2 versus [Ca2+]i for the background mutations in αA (A), αB (B), and βC (C) with (red circles) and without (black circles) mD369G, and on the background of WT with (red dashed line) and without (black dashed line) mD369G. (D) The maximum mD369G-induced increase in Ca2+ dependent activation on the background of WT and mutations. ΔV1/2(+Ca2+) is the maximum V1/2 shift caused by mD369G, and measured by the length of the blue lines in (A–C) on respective backgrounds. Note that ΔV1/2(+Ca2+) was measured at 1.8 µM [Ca2+]i on all backgrounds except for on the background of mutation in αA, where ΔV1/2(+Ca2+) was measured at 111.5 µM [Ca2+]i. ΔV1/2(0Ca2+) is the V1/2 shift caused by mD369G at 0 [Ca2+]i, measured by the length of the cyan lines in (A–C). The asterisk indicates that the data is significantly different from that on the WT background (p < 0.0005 in unpaired Student’s t-test). (E) ΔV1/2 in the absence (hollow bars) or presence (solid bars) of 2 M sucrose. ΔV1/2 = V1/2 at 0 [Ca2+]i - V1/2 at 200 µM [Ca2+]i. The asterisk indicates that ΔV1/2 in the presence of sucrose is significantly differently from that in the absence of sucrose (p < 0.05 in student’s t test).
Figure 7
Figure 7. Spatial distribution and conservation of the residues important for Ca2+ dependent activation
(A and B) The structure of the MthK gating ring (grey) superimposed with the homology model of the BK channel AC region (orange) either without (A, top view) or with (B, side view) the pore domain of the BK channel (olive). The pore domain of the BK channel is modelled by using Kv1.2 crystal structure as the template. The residues identified in Figure 5A as being important for Ca2+ dependent activation are marked with blue, red, green and cyan colors in the structure. (C) Sequence alignment for the structural motifs in the AC region of Slo and MthK channels. The residues identical to those identified in Figure 5A as being important for Ca2+ dependent activation are in red, and the conserved residues are in purple. The structural motifs are indicated by horizontal lines. BK channels from different species are shown: hSlo1, human (GenBank accession number, GI: 26638649); mSlo1, mouse (347143); bSlo1, bovine (46396286); dSlo1, Drosophila (7301192). Also shown are mSlo3, the pH sensitive mouse Slo3 channel (6680542); cSlo2, the Cl sensitive C. elegans Slo2 channel (5764632); rSlack, the Na+ sensitive rat Slack channel (3978471); and MthK (2622639).
Figure 8
Figure 8. mD369G mutation reduces the flexibility of the AC region in molecular dynamics simulations
(A) RMS fluctuation of Cα’s in the AC region obtained from molecular dynamics simulations of WT and D369A, E, G, N, P and W. Color shades indicate the structural motifs in the AC region, the dynamics of which are significantly affected by mD369G. (B) Motion of the WT (top) and mD369G (bottom) AC regions along the principal eigenvector from minima to maxima. Color codes are the same as in (A).

Comment in

References

    1. Ansari A, Jones CM, Henry ER, Hofrichter J, Eaton WA. The role of solvent viscosity in the dynamics of protein conformational changes. Science. 1992;256:1796–1798. - PubMed
    1. Ashcroft FM. Ion Channels and Disease: Channelopathies. San Diego, California, USA: Academic Press; 2000.
    1. Atkinson NS, Robertson GA, Ganetzky B. A component of calcium-activated potassium channels encoded by the Drosophila slo locus. Science. 1991;253:551–555. - PubMed
    1. Beece D, Eisenstein L, Frauenfelder H, Good D, Marden MC, Reinisch L, Reynolds AH, Sorensen LB, Yue KT. Solvent viscosity and protein dynamics. Biochemistry. 1980;19:5147–5157. - PubMed
    1. Bezanilla F. How membrane proteins sense voltage. Nat. Rev. Mol. Cell Biol. 2008;9:323–332. - PubMed

Publication types

MeSH terms