. 2010 Jun 25;32(6):743-53.
doi: 10.1016/j.immuni.2010.06.002.

Mammalian target of rapamycin protein complex 2 regulates differentiation of Th1 and Th2 cell subsets via distinct signaling pathways

Affiliations

Mammalian target of rapamycin protein complex 2 regulates differentiation of Th1 and Th2 cell subsets via distinct signaling pathways

Keunwook Lee et al. Immunity. .

Abstract

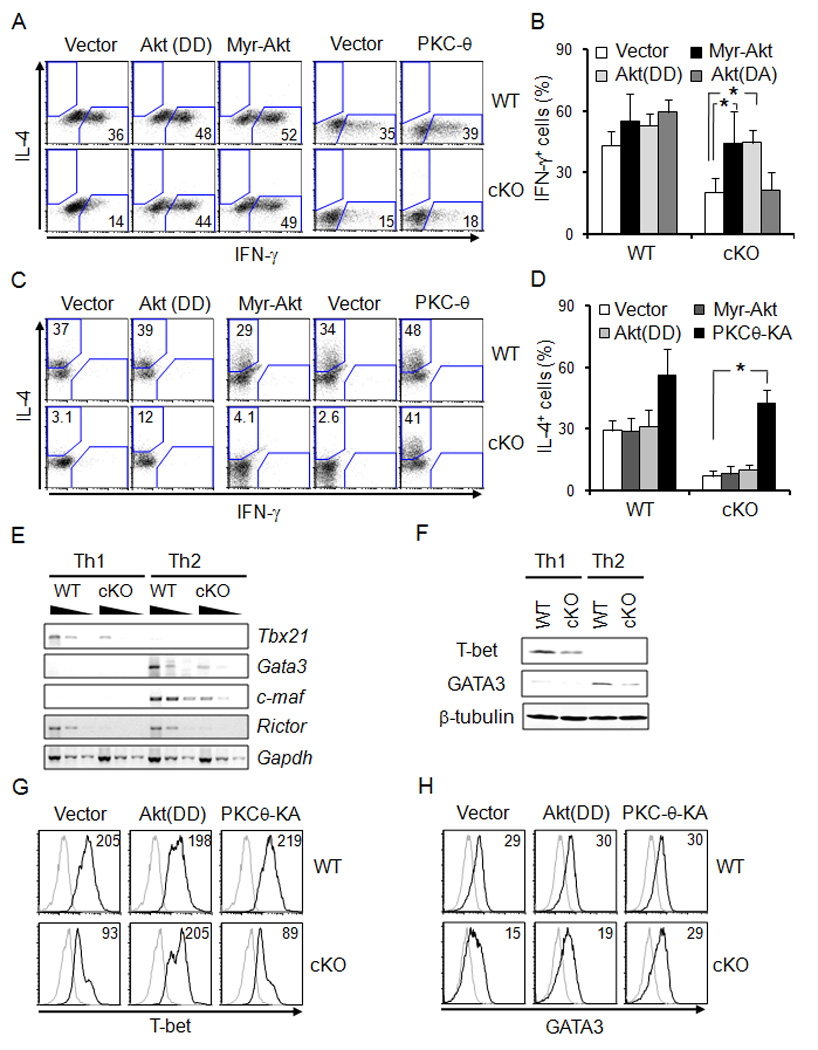
Many functions of the mammalian target of rapamycin (mTOR) complex 1 (mTORC1) have been defined, but relatively little is known about the biology of an alternative mTOR complex, mTORC2. We showed that conditional deletion of rictor, an essential subunit of mTORC2, impaired differentiation into T helper 1 (Th1) and Th2 cells without diversion into FoxP3(+) status or substantial effect on Th17 cell differentiation. mTORC2 promoted phosphorylation of protein kinase B (PKB, or Akt) and PKC, Akt activity, and nuclear NF-kappaB transcription factors in response to T cell activation. Complementation with active Akt restored only T-bet transcription factor expression and Th1 cell differentiation, whereas activated PKC-theta reverted only GATA3 transcription factor and the Th2 cell defect of mTORC2 mutant cells. Collectively, the data uncover vital mTOR-PKC and mTOR-Akt connections in T cell differentiation and reveal distinct pathways by which mTORC2 regulates development of Th1 and Th2 cell subsets.


Figures

Figure 1
Figure 1
Costimulation enhances phosphorylation of Akt HM (S473). Phosphorylated and total pools of the indicated proteins were analyzed by immunoblotting. CD4+ T cells were stimulated (40 min) with 0.5 µg/ml plate-bound αCD3, 2.5 µg/ml of soluble αCD28, or both, as described in the Methods. Bar graphs quantify phosphorylation of Akt, S6K1, and PKC(−θ), with each sample normalized to the level of unphosphorylated protein in one experiment representative of three replicates.
Figure 2
Figure 2
Impaired Akt phosphorylation and activity in rictor-deficient T cells. (A) T cell numbers from lymphoid organs of 6–8 week-old mice. Shown are mean (±SEM) numbers of cells of the indicated types (spleen and pooled lymph nodes of 8 WT and 8 cKO mice; *p < 0.05) (B) Previously activated CD4+ T cells were stimulated (40 min) with αCD3, αCD28, or both and analyzed by immunoblotting (as in Fig. 1A). Akt S473 and S6K1 T389 phosphorylation were normalized to amounts of unphosphorylated protein in the same sample, and then to amounts in WT CD4+ cells (bar graphs from one experiment representative of two complete replicates, with additional replicates of αCD3 + αCD28 vs control). (C, D) Decreased Akt enzymatic activity in T cells deficient for mTORC2. (C)) Akt activation loop (T308) phosphorylation in T cells lacking rictor (one result representative of two replicates with similar results). (D) A representative result assaying Akt kinase in extracts of WT and cKO CD4+ T cells. Cells were activated and restimulated as in (B); numbers represent quantified signals, normalized to the amounts of Akt in each sample and expressed as arbitrary light units with resting WT cells set as 1. Samples are as in (C). Additional information is in supplemental Fig. S1.
Figure 3
Figure 3
mTORC2 selectively regulates differentiation of helper T cell subsets and responses. CD4+ T cells cultured for 5 d under Th1, Th2, or Th17 cell conditions, re- stimulated with αCD3 + αCD28, and analyzed by (A) flow cytometry for intracellular cytokines or(B) ELISA with culture supernatants. Shown are profiles for IFN-γ and IL-4 in the CD4+ viable cell gate, or IL-17A and IFN-γ in rictor-deficient CD4+ T cells [one result representative of 3 replicate experiments (A)] and means [±SEM; n=5 (B)]. (C) mTORC2 impedes induction of iTreg cell phenotype. Naïve CD4+ T cells (leftmost panels) from WT and cKO mice were activated (αCD3 + αCD28) and grown in the absence or presence of TGF-β for 3 d. Shown are histograms of FoxP3 expression in the CD4+ gate of freshly isolated naïve T cells or activated T cells, from one representative experiment. (D) Normal Treg cell populations under T helper-inducing conditions. CD4+ T cells activated and cultured under the Th1, Th2, and Th17 cell conditions were analyzed by flow cytometry as in (C). (E–I) Impairment of responses in vivo. Each symbol represents one mouse, solid lines denote mean values; * p<0.05 (two independent experiments). (E, F) Impaired IgG2a, but not IgG3, anti-KLH response in rictor cKO mice. Groups of WT and cKO mice were immunized with KLH in IFA and boosted with KLH in IFA 14 d later. Sera were collected on day 19, 5 d after the boost. Shown are capture ELISA results for IgG2a (E) and IgG3 (F). (G) WT and cKO mice were challenged with L. monocytogenes and analyzed as described in the Methods. Shown are log10-scale results of ELISPOT assays (two independent experiments) performed using the immunodominant class II MHC peptide LLO190–201 as indicated (10, 100 nM); each dot represents one mouse, solid lines denote mean values (panels are arranged vertically). (H, I) Decreased IgG1 and IgE production in rictor cKO mice. As in (E, F), but mice were immunized with low-endotoxin ovalbumin in alum, and ELISA results shown are for Ag-specific IgE (H), and IgG1 (I); ANOVA across the full dilution curves and all indicated differences were significant at p<0.05. Additional information is in supplemental Fig. S2.
Figure 4
Figure 4
Decreased proliferation but normal survival of rictor-deficient T cells. (A) Splenocytes of WT and rictor cKO mice assayed for 3H-thymidine incorporation 48 h after activation with αCD3 + αCD28 (representing three replicate experiments). (B) As in (A), except that cells were analyzed by flow cytometry for BrdU incorporation (left panel) or division history using CFSE partitioning (right panel). Shown are histograms of events in the CD4+ and viable lymphoid gates from one experiment representative of three replicates. (C) Mean (±SEM) from one of two replicate experiments measuring viable CD4+ T cell numbers after triplicate cultures (1–3 d) with or without IL-4, expressed as a percentage of the input viable cell counts. (D) Spleen cells were cultured (20 h) in the presence or absence of IL-4 and assayed by TUNEL. Shown are flow cytometry profiles for CD4+ cells; numbers denote % TUNEL positive cells in one experiment representative of 4 replicates. (E) Cells were irradiated, cultured in the presence or absence of IL-4, and assayed by TUNEL. Additional information is in supplemental Fig. S3.
Figure 5
Figure 5
Reciprocal effects of Akt and PKC-θ, downstream from mTORC2, in T helper differentiation. (A–D) CD4+ T cells were activated under non-differentiating conditions, transduced with the indicated constructs, cultured for 5 days under (A, B) Th1 or (C, D) Th2 cell polarizing conditions, restimulated, and analyzed by flow cytometry. Shown are flow data for IFN-γ and IL-4 in the GFP+ CD4+ gate (A, C) (representative result from one of ≥3 replicate experiments). (B, D) Experimental results are summarized as mean (±SEM) % IFN-γ+ or % IL-4+ cells in the in the GFP+ CD4+ gate. (E, F) Impaired T-bet and GATA3 expression in rictor-deficient T cells. CD4+ T cells were cultured (4 d) in Th1 or Th2 cell conditions, and assayed using RT-PCR on serial 5-fold template dilutions to compare levels of mRNAs (E), or immunoblotting (F). (G, H) Selective reversion of decreased T-bet or GATA-3 expression in rictor cKO CD4+ T cells. CD4+ T cells were activated, transduced, switched to differentiating conditions, and analyzed by FACS as in A–D, except that intracellular stains were for T-bet (G) and GATA-3 (H) in the GFP+ CD4+ gate. Shown are representative histograms for the signal of isotype controls (thin line) or α(T-bet or GATA-3, thick line) in one experiment representative of two replicates. Inset numbers represent the net signal as MFI (active Ab – isotype signal) in each sample. Additional information is in supplemental Fig. S4 and Methods.
Figure 6
Figure 6
mTORC2 exerts differential effects on downstream targets while sparing Stat protein tyrosyl phosphorylation. (A) Normal induction of phosphotyrosyl STAT transcription factors in rictor cKO mice T cells. CD4+ T cells were treated 40 min with the indicated cytokine or left unstimulated, then analyzed by immunoblotting with anti–P-STAT6Y641 or P-STAT3Y705. (B) Naïve, freshly purified CD4+ T cells from WT and cKO mice were stimulated as in Fig. 1 and analyzed by Western blotting (one experiment representative of two replicates). (C) Due to limiting amounts of protein from naïve T cells, purified cells were activated, rested after growth in vitro, restimulated, and analyzed (as for B). The bar graph presents the result of quantitation of the signal for P-FoxO1 (one experiment representative of three replicates). (D) Impairment of the activation-induced increase in expression of galectin-3, a FoxO1-regulated gene. FACS profiles for galectin on freshly isolated and activated (αCD3, αCD28, and 10 ng/ml IL-4 for 2 d) CD4+ T cells in one experiment representative of two replicates, and a bar graph quantitating the results, are shown. Additional information is in supplemental Fig. S5.
Figure 7
Figure 7
mTORC2 regulation of NF-κB activity via PKC. (A) Regulation of CD62L expression on T cells. Shown are FACS profiles of CD62L and CD44 expression on freshly isolated or activated (as in Fig. 4) CD4+ T cells (one experiment representative of four replicates). Inset numbers: frequencies (%) in each quadrant. (B) Rictor dependence of nuclear NF-κB subunits and the NF-κB-regulated protein Bcl-3 after TCR-CD28 costimulation. CD4+ T cells were activated and a portion of each was re-stimulated with αCD3 and αCD28 as in Fig. 6. After separation of nuclear (N) and cytosolic (C) fractions and resolution by SDS-PAGE, immunoblots were probed for the indicated species (one experiment representative of 2–3 replicates). Inset numbers: relative signals for each protein in the nuclei after normalization to lamin-A, with the nuclei of resting, previously activated WT cells set at 1. (C, D) PKC-θ reverses a defect mTORC2-deficient T cells in TCR-CD28 costimulatory induction of NF-κB transcriptional activity. (C) Activated CD4+ T cells were transfected with the RE/AP-luciferase reporter construct along with a constitutively active Renilla luciferase, and restimulated with αCD3 and αCD28. Relative activity: firefly luciferase measured 6 h after restimulation and normalized for transfection efficiency (one experiment representative of three replicates). (D) As in (C) except that cells also were co-transfected with empty vector or vector encoding the kinase-active PKC-θ mutant and the data are pooled from two independent replicates. (E) Decreased expression of Bcl-3. As in (A) except that the overall level of Bcl-3 was analyzed using whole-cell extracts. (F) mTORC2 promotes TCR-CD28-induction of ICAM-1 avidity. Using lymph node T cells ± stimulation with αCD3 and αCD28, activation- and avidity-dependent binding of Fc-ICAM-1-αFc complexes to CD4+ T cells was measured by flow cytometry. The frequencies (%) of ICAM-1-binding cells within the CD4+ gate are indicated by inset numbers, with results from two independent experiments summarized (right). Additional information is in supplemental Fig. S6.

Comment in

References

    1. Andres P, Howland K, Nirula A, Kane L, Barron L, Dresnek D, Sadra A, Imboden J, Weiss A, Abbas AK. Distinct regions in the CD28 cytoplasmic domain are required for T helper type 2 differentiation. Nat Immunol. 2004;5:435–442. - PubMed
    1. Battaglia M, Stabilini A, Roncarolo MG. Rapamycin selectively expands CD4+CD25+FoxP3+ regulatory T cells. Blood. 2005;105:4743–4748. - PubMed
    1. Blazar B, Taylor P, Panoskaltsis-Mortari A, Vallera D. Rapamycin inhibits the generation of graft-versus-host disease- and graft-versus-leukemia-causing T cells by interfering with the production of Th1 or Th1 cytotoxic cytokines. J Immunol. 1998;160:5355–5365. - PubMed
    1. Cannons JL, Yu L, Hill B, Mijares L, Dombroski D, Nichols KE, Antonellis A, Koretzky G, Gardner K, Schwartzberg PL. SAP regulates T(H)2 differentiation and PKC-theta-mediated activation of NF-kappaB1. Immunity. 2004;21:693–706. - PubMed
    1. Carriere A, Cargnello M, Julien L, Gao H, Bonneil E, Thibault P, Roux P. Oncogenic MAPK signaling stimulates mTORC1 activity by promoting RSK-mediated raptor phosphorylation. Curr Biol. 2008;18:1269–1277. - PubMed

Publication types

Substances