. 2010 Jun 25;32(6):803-14.
doi: 10.1016/j.immuni.2010.06.007.

Interleukin-1beta selectively expands and sustains interleukin-22+ immature human natural killer cells in secondary lymphoid tissue

Affiliations

Interleukin-1beta selectively expands and sustains interleukin-22+ immature human natural killer cells in secondary lymphoid tissue

Tiffany Hughes et al. Immunity. .

Abstract

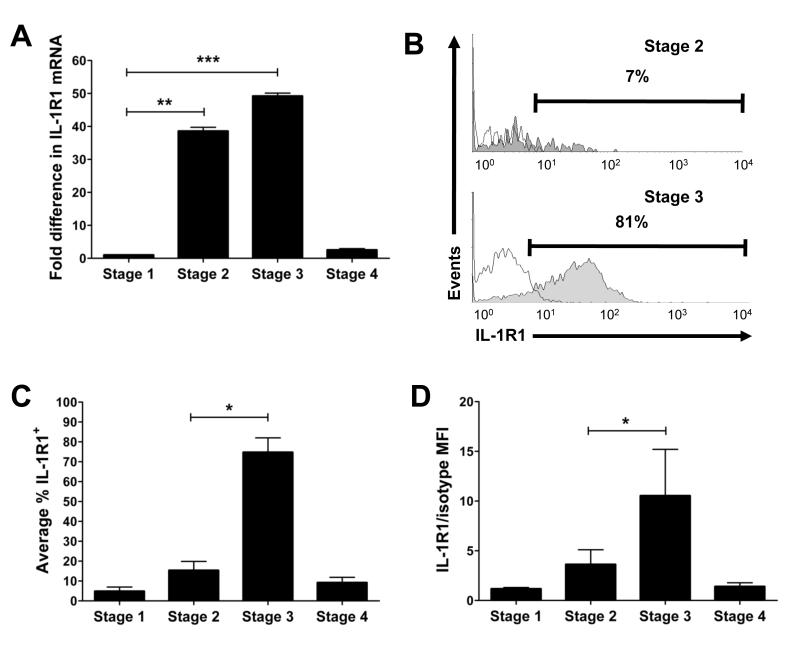
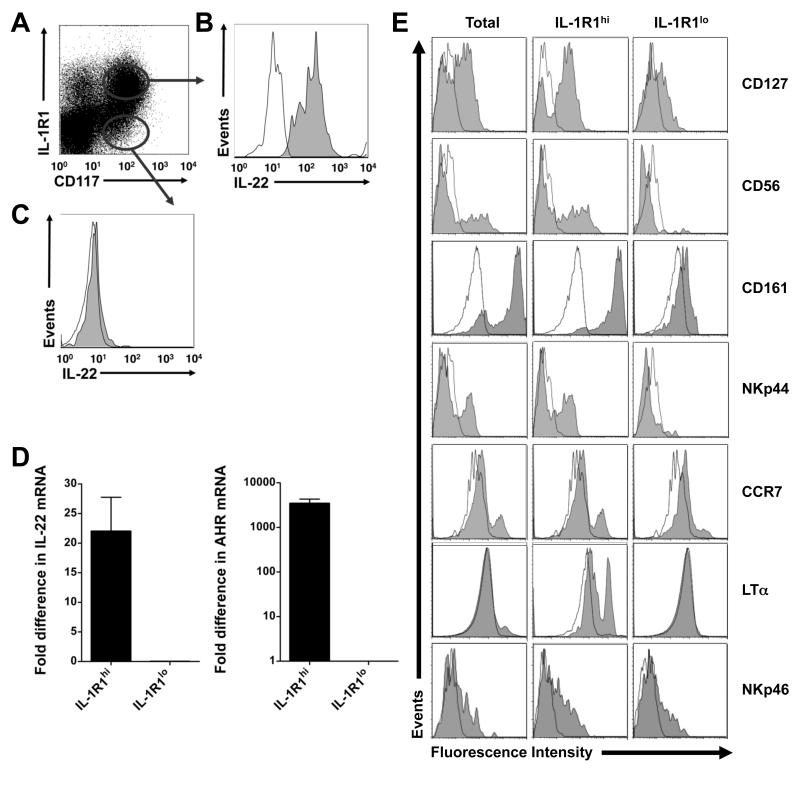
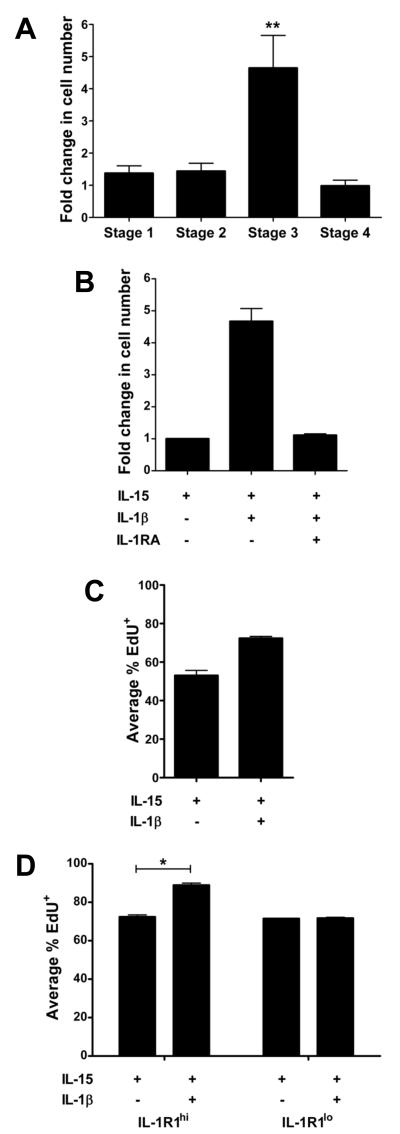
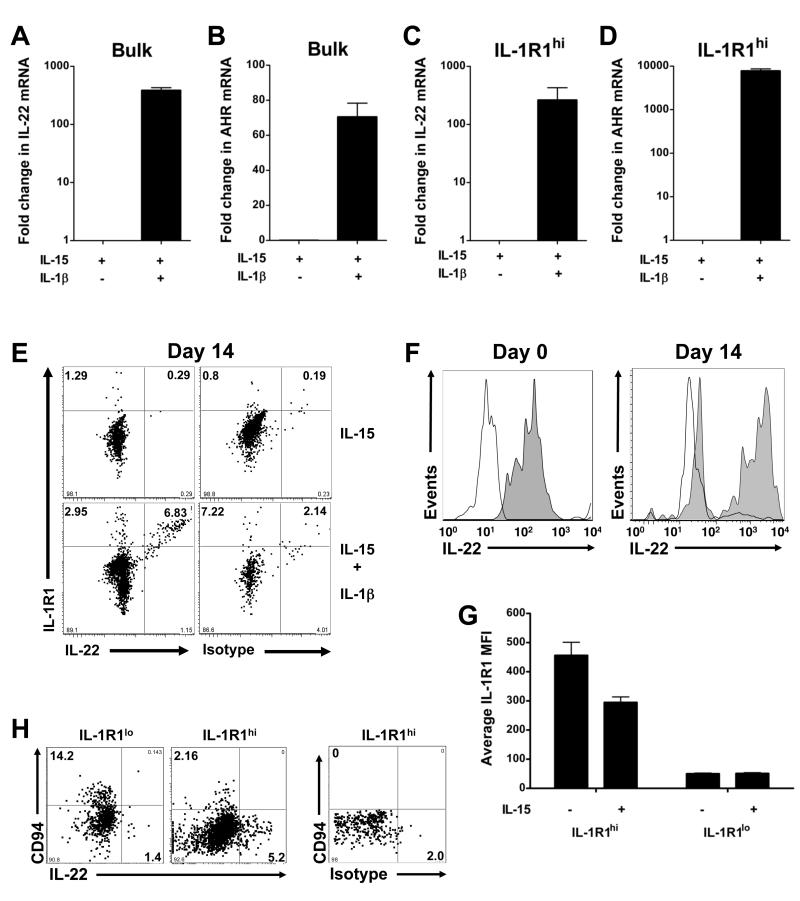
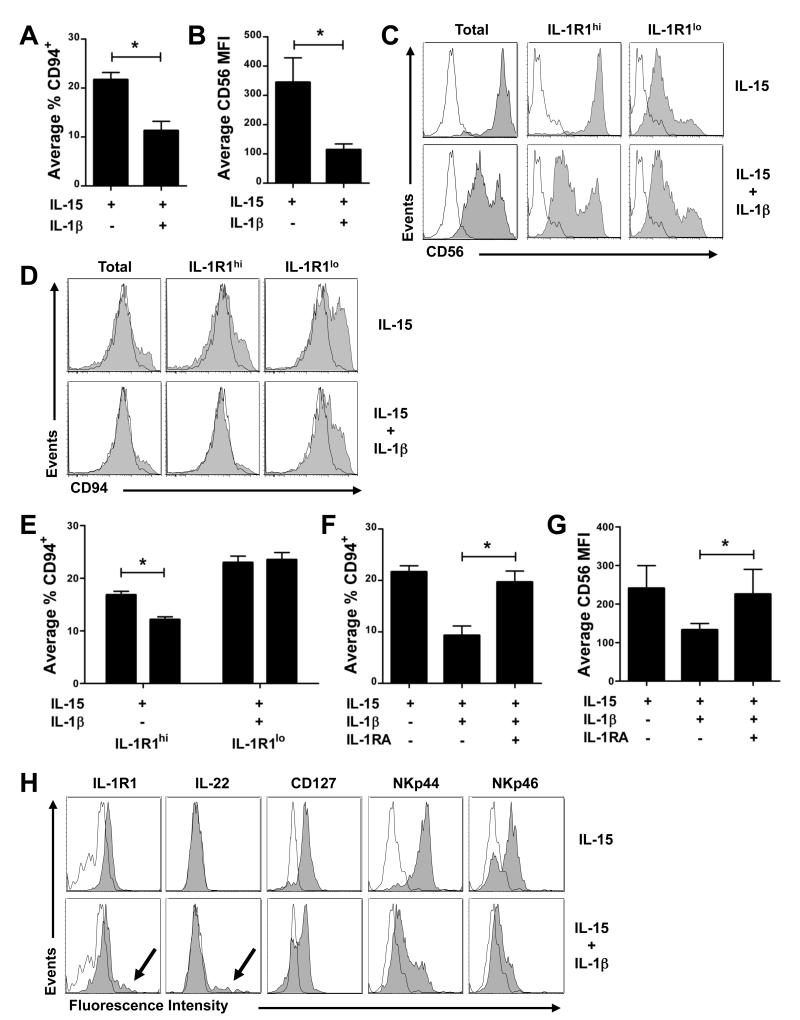
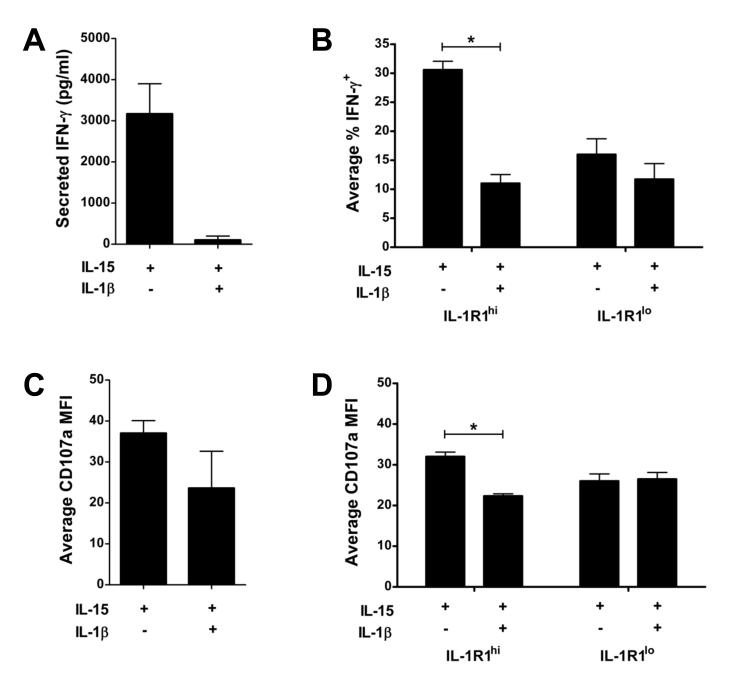
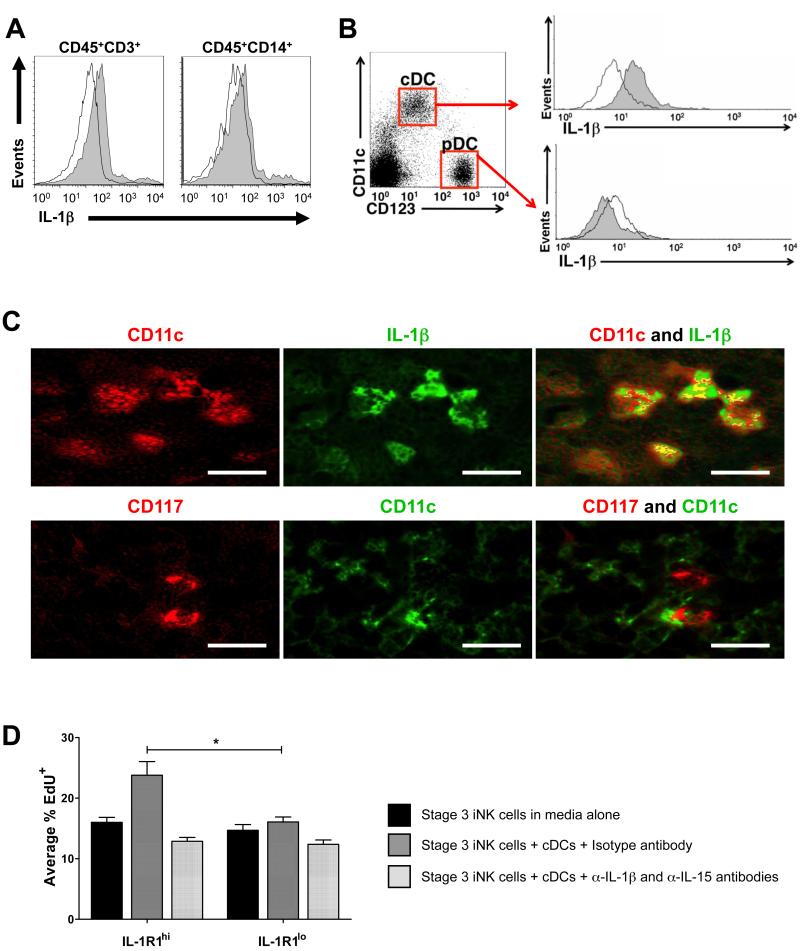
Among human natural killer (NK) cell intermediates in secondary lymphoid tissue (SLT), stage 3 CD34(-)CD117(+)CD161(+)CD94(-) immature NK (iNK) cells uniquely express aryl hydrocarbon receptor (AHR) and interleukin-22 (IL-22), supporting a role in mucosal immunity. The mechanisms controlling proliferation and differentiation of these cells are unknown. Here we demonstrate that the IL-1 receptor IL-1R1 was selectively expressed by a subpopulation of iNK cells that localized proximal to IL-1beta-producing conventional dendritic cells (cDCs) within SLT. IL-1R1(hi) iNK cells required continuous exposure to IL-1beta to retain AHR and IL-22 expression, and they proliferate in direct response to cDC-derived IL-15 and IL-1beta. In the absence of IL-1beta, a substantially greater fraction of IL-1R1(hi) iNK cells differentiated to stage 4 NK cells and acquired the ability to kill and secrete IFN-gamma. Thus, cDC-derived IL-1beta preserves and expands IL-1R1(hi)IL-22(+)AHR(+) iNK cells, potentially influencing human mucosal innate immunity during infection.


Figures

Figure 1
Figure 1. IL-1R1 expression during NK cell development
(A) IL-1R1 mRNA expression ex vivo in flow cytometry purified human stage 1-4 SLT NK developmental intermediates assessed via Real-Time PCR. Fold difference in IL-1R1 mRNA is relative to that in stage 1, arbitrarily normalized to 1 (n = 4). (B-D) Total CD3CD19 tonsillar mononuclear cells were stained for surface expression of CD34, CD117, CD94, and IL-1R1, and gated for each stage as described (Freud et al., 2006). (B) Histograms show IL-1R1 (filled) and isotype (empty) surface staining in stage 2 (top) or stage 3 (bottom) cells from a representative donor (n = 4). (C,D) Shown within each gated SLT NK developmental intermediate populations are average: (C) % of cells with IL-1R1 surface expression (n = 4), and (D) density of IL-1R1 surface expression, as represented by the ratio of IL-1R1 mean fluorescence intensity (MFI) to isotype MFI (n = 6). Data in A, C, D presented as mean ± SEM (*, P ≤ 0.05; **, P ≤ 0.005; ***, P ≤ 0.0005).
Figure 2
Figure 2. IL-1R1hi and IL-1R1lo subpopulations of stage 3 iNK cells ex vivo
(A-C) Tonsillar mononuclear cells were stained ex vivo for surface expression of CD117, IL-1R1, and (B,C) intracellular IL-22. (A) Gated on Lin (CD3CD14CD16CD19CD34CD94) lymphocytes, dot plot indicates gates for IL-1R1hi (upper) or IL-1R1lo (lower) subpopulations of CD117+ stage 3 iNK cells as sorted in a representative donor (n = 18). (B,C) Gating as indicated in (A), histograms depict staining with isotype (empty) or α-IL-22 (filled) antibody in a representative donor (n = 5). (D) IL-22 and AHR mRNA measured via Real-Time PCR ex vivo in flow cytometry sorted IL-1R1hi and IL-1R1lo subpopulations of stage 3 iNK cells. “Fold difference” was quantified relative to expression in the IL-1R1lo subpopulation, arbitrarily normalized to 1 (P ≤ 0.05). Data in D presented as mean ± SEM (n = 6). (E) Using gating as indicated in (A), histograms depict a representative donor stained ex vivo with isotype (empty) or antibody specific for the indicated antigen (filled), within total stage 3 iNK cells or IL-1R1hi and IL-1R1lo subpopulations of stage 3 iNK cells (n ≥ 4). The IL-1R1CD117 and IL-1R1+CD117 subsets noted in (A) were both non-reactive for intracellular IL-22 protein staining.
Figure 3
Figure 3. Treatment with IL-15 and IL-1β promotes the selective expansion of stage 3 iNK cells
(A,B) “Fold change” was calculated and averaged from 11 donors as: absolute number of cells enumerated (by Trypan blue exclusion) after 14 d of culture in IL-15 and IL-1β divided by the absolute number of cells enumerated after 14 d of culture in IL-15 alone. For example, starting with 5,000 stage 3 iNK cells/well, four representative donors cultured in IL-15 and IL-1β expanded to 90,000, 285,000, 162,000, and 40,000, while the same four donors’ stage 3 iNK cells cultured in IL-15 alone expanded to 20,000, 55,0000, 45,000 and 10,000 cells, respectively. Results revealed a selective growth advantage among stage 3 iNK cells in response to culture with IL-15 and IL-1β (**, P < 0.005; n = 11), (B) which was completely abrogated in the presence of IL-1RA (P < 0.05; n = 4). (C,D) Proliferation assessed via EdU incorporation in (C) total stage 3 iNK cells (P < 0.05; n = 8) or (D) IL-1R1hi and IL-1R1lo subpopulations of stage 3 iNK cells (*, P = 0.01; n = 3) after culture for 14 d in the presence of IL-15 or IL-15 and IL-1β. Data in A-D depicted as mean ± SEM.
Figure 4
Figure 4. IL-1β sustains IL-22 and AHR expression in IL-1R1hi stage 3 iNK cells
(A-D) IL-22 and AHR transcript expression following 14 d in the presence of IL-15 or IL-15 and IL-1β, shown in (A,B) total (“bulk”) stage 3 iNK cells, or (C,D) the IL-1R1hi subpopulation of stage 3 iNK cells. Results depicted as the mean ± SEM, and P ≤ 0.05 in each (n ≥ 4). (E) Dot plots depict surface IL-1R1 and intracellular staining with IL-22 or isotype antibody in IL-1R1hi stage 3 iNK cells from a representative donor cultured for 14 d in the presence of IL-15 or IL-15 and IL-1β (n = 6). All IL-22+ cells co-expressed IL-1R1. (F) Histograms from a representative donor (n = 4) depict staining with IL-22 (filled) or isotype (empty) antibody in the IL-1R1hi subpopulation of stage 3 iNK cells d 0, and within IL-1R1+ cells remaining after culture for 14 d with IL-15 and IL-1β (G) IL-1R1 MFI assessed via flow cytometry after a 6 h culture in the presence of IL-15 or media alone (n = 3). (H) Representative staining for surface CD94 and intracellular IL-22 protein at d 14 in cells cloned from either a single IL-1R1lo stage 3 iNK cell or an IL-1R1hi stage 3 iNK cell. Isotype staining on far right.
Figure 5
Figure 5. IL-1β inhibits differentiation of IL-1R1hi stage 3 iNK cells
Surface expression of (A,D,E) CD94 and (B,C) CD56 assessed after 14 d of in vitro culture of sorted (A,B) total, or (C,D,E) IL-1R1hi and IL-1R1lo subpopulations of stage 3 iNK cells with IL-15 or IL-15 and IL-1β. (F,G) CD94 and CD56 were also assessed after bulk stage 3 iNK cells were cultured for 14 d in the presence of IL-15, IL-15 and IL-1β, or IL-15 with IL-1β and IL-1RA. (H) Histograms depict staining with isotype (empty) or antibody specific for the indicated antigen (filled) after culture of IL-1R1hi stage 3 iNK cells for 14 d in the presence of IL-15 or IL-15 and IL-1β. Arrows indicate high density expression for IL-1R1 and IL-22 (also see Figure 4F). Data in A, B, E, F, and G presented as the mean ± SEM (*, P ≤ 0.05; n ≥ 4). Histograms in C, D, and H depict staining in a representative donor (n ≥ 4).
Figure 6
Figure 6. IL-1β impedes the IL-1R1hi subpopulation of stage 3 iNK cells from acquiring IFN-γ production and degranulation
(A,C) Total or (B,D) IL-1R1hi and IL-1R1lo subpopulations of stage 3 iNK cells sorted from SLT were cultured for 14 d in vitro with IL-15 or IL-15 and IL-1β. Cells were replated in equal numbers and either: (A,B) stimulated for 12 h with IL-15 + IL-12 + IL-18 to assess IFN-γ secretion via (A) ELISA (P < 0.005; n = 7) or (B) intracellular flow (n = 8); or (C,D) incubated overnight with K562 targets (4:1 E/T ratio) and assessed for surface expression of the degranulation marker CD107a by flow cytometry (n = 3; for C, P = 0.14). Data in B depicts IFN-γ expression after gating on the population which had acquired CD94 surface expression. Data presented as mean ± SEM (*, P ≤ 0.01).
Figure 7
Figure 7. Stage 3 iNK cells reside in the vicinity of IL-1β+ CD11chi cDCs within SLT
(A,B) Intracellular staining of unstimulated SLT mononuclear cells from a representative donor (n = 3) with isotype (empty) or α-IL-1β (filled) antibody shown after gating on (A) CD45+CD3+ T cells and CD45+CD14+ monocytes and macrophages, or (B) CD123hiCD11clo pDCs and CD123loCD11chi cDCs subsets. (C) Immunohistochemical staining depicted in serial sections of human tonsil from a representative donor (n = 4). Yellow areas indicate co-expression, as shown for CD11chi and IL-1β (top). CD117+ cells did not co-express CD11c, but were located in proximity of CD11chi cDCs (bottom). Magnification, 400x. Bar, 30 μM. (D) EdU incorporation in sorted IL-1R1hi and IL-1R1lo subpopulations of stage 3 iNK cells after 6 h with α-MEM medium alone, or in the presence of autologous BDCA-1+ cDCs (4:1 iNK:cDC ratio) with either isotype or α-IL-15 and α-IL-1β blocking antibodies. Depicted is % of CD117+ lymphocytes which were also EdU+ (*, P = 0.05; n = 3). Data in D presented as mean ± SEM.

Comment in

References

    1. Alter G, Malenfant JM, Altfeld M. CD107a as a functional marker for the identification of natural killer cell activity. J Immunol Methods. 2004;294:15–22. - PubMed
    1. Arend WP, Malyak M, Bigler CF, Smith MF, Jr., Janson RW. The biological role of naturally-occurring cytokine inhibitors. Br J Rheumatol. 1991;30(Suppl 2):49–52. - PubMed
    1. Ayyoub M, Deknuydt F, Raimbaud I, Dousset C, Leveque L, Bioley G, Valmori D. Human memory FOXP3+ Tregs secrete IL-17 ex vivo and constitutively express the T(H)17 lineage-specific transcription factor RORgamma t. Proc Natl Acad Sci U S A. 2009;106:8635–8640. - PMC - PubMed
    1. Betts MR, Brenchley JM, Price DA, De Rosa SC, Douek DC, Roederer M, Koup RA. Sensitive and viable identification of antigen-specific CD8+ T cells by a flow cytometric assay for degranulation. J Immunol Methods. 2003;281:65–78. - PubMed
    1. Carter DB, Deibel MR, Jr., Dunn CJ, Tomich CS, Laborde AL, Slightom JL, Berger AE, Bienkowski MJ, Sun FF, McEwan RN, et al. Purification, cloning, expression and biological characterization of an interleukin-1 receptor antagonist protein. Nature. 1990;344:633–638. - PubMed

Publication types

MeSH terms