. 2010 Jun 25;32(6):840-51.
doi: 10.1016/j.immuni.2010.06.003.

Discrete roles of STAT4 and STAT6 transcription factors in tuning epigenetic modifications and transcription during T helper cell differentiation

Affiliations

Discrete roles of STAT4 and STAT6 transcription factors in tuning epigenetic modifications and transcription during T helper cell differentiation

Lai Wei et al. Immunity. .

Abstract

Signal transducer and activator of transcription 4 (STAT4) and STAT6 are key factors in the specification of helper T cells; however, their direct roles in driving differentiation are not well understood. Using chromatin immunoprecipitation and massive parallel sequencing, we quantitated the full complement of STAT-bound genes, concurrently assessing global STAT-dependent epigenetic modifications and gene transcription by using cells from cognate STAT-deficient mice. STAT4 and STAT6 each bound over 4000 genes with distinct binding motifs. Both played critical roles in maintaining chromatin configuration and transcription of a core subset of genes through the combination of different epigenetic patterns. Globally, STAT4 had a more dominant role in promoting active epigenetic marks, whereas STAT6 had a more prominent role in antagonizing repressive marks. Clusters of genes negatively regulated by STATs were also identified, highlighting previously unappreciated repressive roles of STATs. Therefore, STAT4 and STAT6 play wide regulatory roles in T helper cell specification.


Figures

Figure 1
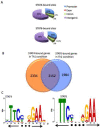
Figure 1. Genomic distribution of STAT binding sites and identification of consensus binding motifs
(A, B) ChIP-seq analysis was used to map STAT4 and STAT6 binding from polarized Th1 and Th2 cells. The distribution of (A) STAT4 and STAT6 binding sites was analyzed based on location: promoter (within 10 kb upstream from the transcription start site), exon, intron, and intergenic regions. (B) Venn diagram showing the number of genes uniquely bound by STAT4, STAT6 or genes bound by both STATs. STAT-bound genes were identified if at least one peak of binding was present within the gene region defined as 10 kb upstream of TSS to the transcription end site. (C) A parallel version of MEME (Bailey and Elkan, 1994) was used to perform a de novo search of consensus binding motifs for STAT4 and STAT6 and resulted in distinctive GAA palindromes for STAT4 with 3 bp spacer and STAT6 with 4 bp spacer.
Figure 2
Figure 2. Global STAT binding and epigenetic modifications
(A, B) ChIP-seq was performed to map histone epigenetic modification in Th1 cells and Th2 cells. The concordance between H3K4me3, H3K27me3 modifications and (A) STAT4 binding sites in Th1 cells and (B) STAT6 binding sites in Th2 cells is shown. (C, D) Compiled tag density profiles for H3K4me3, H3K27me3, H3K36me3 and (C) STAT4 in Th1 cells and (D) STAT6 in Th2 cells are shown. The diagrams represent all genes that showed positive signals for the respective marks. Upper panel: tag density profile across gene body ± 5 kb flanking regions with 200 bp resolution. Lower panel: tag density profile across promoter ± 5 kb flanking regions with 25 bp resolution.
Figure 3
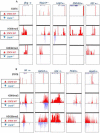
Figure 3. STAT-bound genes represent multiple aspects of Th differentiation
ChIP-seq signal profile maps are shown as a genome browser view. (A) Th1 cell genes, Ifng (chr10:117,875,074-117,885,977), Tbx21 (chr11:96,947,000-96,996,774), Lag3 (chr6:124,848,219-124,863,009), Zbtb32 (chr7:31,374,500-31,385,000), Il21 (chr3:37,119,708-37,136,092), (B) Th2 cell genes, Il4 (chr11:53,418,425-53,444,775), Gata3 (chr2:9,770,098-9,802,379), Il24 (chr1:132,778,117-132,786,123), Plcd1 (chr9:118,980,999-119,011,401) and Hipk2 (chr6:38,641,845-38,850,017). STAT4 and STAT6 binding in wild-type is shown in red upward peaks. Epigenetic marks (H3K4me3, H3K36me3) in wild-type cells are depicted as red upward peaks whereas the accompanying blue colored downward peaks depict the binding in STAT4-deficient cells. Where no signal was detected, the corresponding columns are blank.
Figure 4
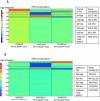
Figure 4. STAT-bound genes form clusters that share common epigenetic signatures
(A, B) The total tag count of each epigenetic modification (H3K4me3, H3K27me3, and H3K36me3) was computed across the body of each STAT-occupied gene in wild-type versus STAT-deficient cells. The ratio of tag counts for three epigenetic modifications was used to cluster STAT-occupied genes by applying the K-means clustering method with squared Euclidean distance with 1000 iterations. (A) STAT4-bound genes in Th1 cells clustered in 6 patterns based on the ratio of wild type vs. STAT4-deficient cells: H3K4me3(K4)-high, H3K36me3 (K36)-high, H3K27me3 (K27)-low, H3K27me3 (K27)-high, H3K36me3 (K36)-low, and an indeterminate pattern. (B) STAT6-bound genes in Th2 cells showed 5 distinct epigenetic patterns similar to A without the K4-high cluster. The accompanying tables list the number and percentage of genes in each cluster.
Figure 5
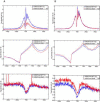
Figure 5. Differential regulation of epigenetic marks by STAT4 and STAT6 on STAT-bound genes
(A, B) Compiled tag density profiles for histone modification marks (H3K4me3, H3K36me3, H3K27me3) were calculated from all STAT4-bound genes in Th1 cells (A) and STAT6-bound genes in Th2 cells (B) in wild type cells (red) and in STAT-deficient cells (blue). The tag density profiles across promoter ± 5 kb flanking regions are shown for H3K4me3 (top panels) and H3K27me3 (bottom panels). The tag density profiles across gene body ± 5 kb flanking regions for H3K36me3 are shown in middle panels.
Figure 6
Figure 6. STAT-dependent epigenetic signature correlates with gene expression
(A, B) STAT-dependent gene expression change was evaluated by microarray for each epigenetic cluster as described in Figure 4. Two-fold change was used as a cut off to sort genes into positively regulated (red bars) and those negatively regulated (blue bars) by STAT4 (A) and by STAT6 (B). Genes whose expression was not affected by STAT4 or STAT6 were not depicted in the graphs.
Figure 7
Figure 7. STAT4 and STAT6 work in concert and in opposition to influence gene expression
(A) ChIP-seq profiles for binding of STAT4 and STAT6, as well as epigenetic modifications in Th1 and Th2 cells. Illustrative genes include: Il10 (chr1:132,911,300-132,926,671), Il7r (chr15:9,430,427-9,470,839), Socs3 (chr11:117,821,153-117,836,725) and Id2 (chr12:25,769,886-25,787,125). (B, C) ChIP-seq data illustrating STAT binding and epigenetic modifications of (B) Ccr8 (chr 9:119,988,491-120,013,456) and (C) Il18r1-Il18rap (chr1:40,521,609-40,620,416).

References

    1. Abbas AK, Murphy KM, Sher A. Functional diversity of helper T lymphocytes. Nature. 1996;383:787–793. - PubMed
    1. Afkarian M, Sedy JR, Yang J, Jacobson NG, Cereb N, Yang SY, Murphy TL, Murphy KM. T-bet is a STAT1-induced regulator of IL-12R expression in naive CD4+ T cells. Nat Immunol. 2002;3:549–557. - PubMed
    1. Ansel KM, Djuretic I, Tanasa B, Rao A. Regulation of Th2 differentiation and Il4 locus accessibility. Annu Rev Immunol. 2006;24:607–656. - PubMed
    1. Bailey TL, Elkan C. Fitting a mixture model by expectation maximization to discover motifs in biopolymers. Proc Int Conf Intell Syst Mol Biol. 1994;2:28–36. - PubMed
    1. Beima KM, Miazgowicz MM, Lewis MD, Yan PS, Huang TH, Weinmann AS. T-bet binding to newly identified target gene promoters is cell type-independent but results in variable context-dependent functional effects. J Biol Chem. 2006;281:11992–12000. - PubMed

Publication types

MeSH terms

Substances

Associated data