. 2010 Jun 25;38(6):908-15.
doi: 10.1016/j.molcel.2010.05.018.

miR-200c regulates induction of apoptosis through CD95 by targeting FAP-1

Affiliations

miR-200c regulates induction of apoptosis through CD95 by targeting FAP-1

Robert Schickel et al. Mol Cell. .

Abstract

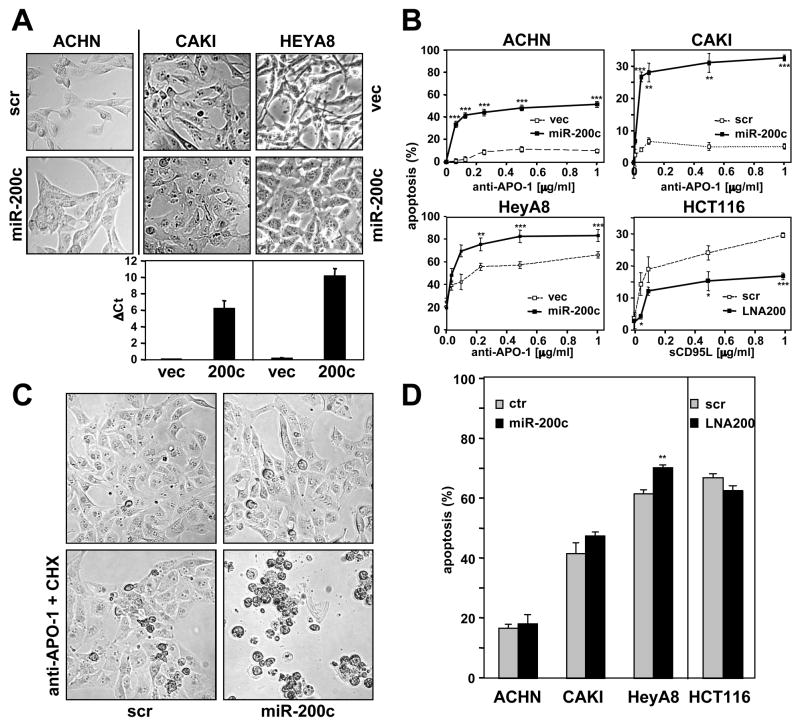
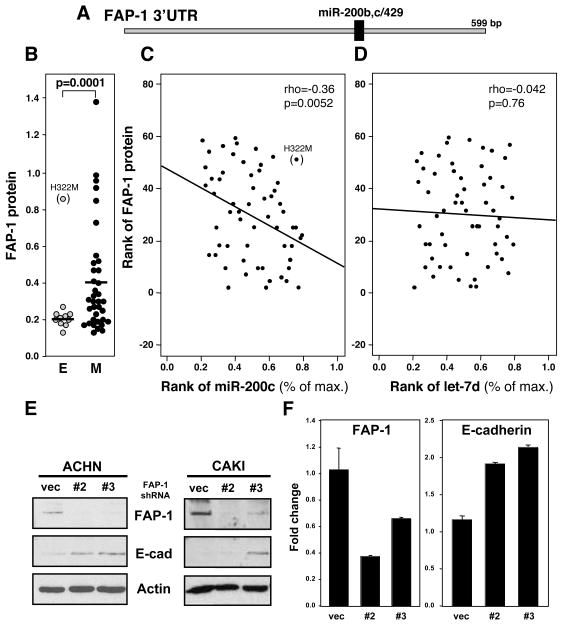
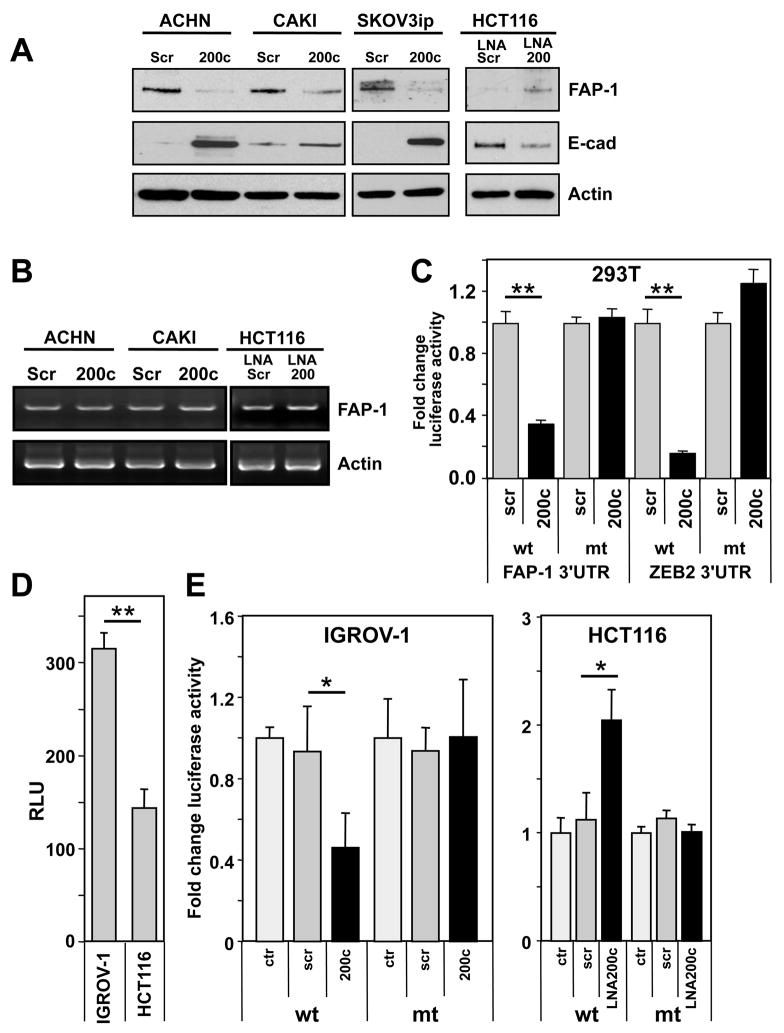
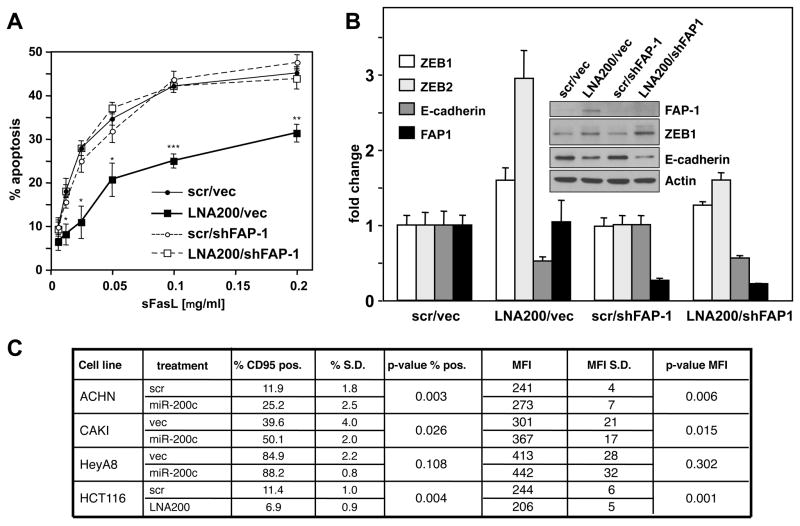
Tumor progression shares many characteristics with the process of epithelial-to-mesenchymal transition (EMT). Cells that have undergone an EMT are known to have an increased resistance to apoptosis. CD95/Fas is an apoptosis-inducing receptor expressed on many tissues and tumor cells. During tumor progression CD95 is frequently downregulated, and tumor cells lose apoptosis sensitivity. miR-200 microRNAs repress both the EMT-inducing ZEB1 and ZEB2 transcription factors. We now demonstrate that miR-200c sensitizes cells to apoptosis mediated by CD95. We have identified the apoptosis inhibitor FAP-1 as a target for miR-200c. FAP-1 was demonstrated to be responsible for the reduced sensitivity to CD95-mediated apoptosis in cells with inhibited miR-200. The identification of FAP-1 as an miR-200c target provides a molecular mechanism to explain both the downregulation of CD95 expression and the reduction in sensitivity of cells to CD95-mediated apoptosis that is observed in the context of reduced miR-200 expression during tumor progression.


Figures

Figure 1
Figure 1. Altering Levels of miR-200 Changes Sensitivity of Cells to CD95-induced Apoptosis
(A) Phase contrast pictures showing morphological changes of cells transfected with scrambled pre-miRNA (scr) and pre-miR-200c (3 times over 9 days) or cells stably infected with a retrovirus expressing scrambled oligo (vec) and miR-200c. Levels of mir-200c in retrovirus infected cells were quantified by real-time PCR. (B) Cells shown in A stimulated through CD95. HCT116 cells were transfected with LNA200 seven times prior to stimulation. Cells ectopically expressing miR-200c or cells treated with LNA200 were stimulated with different concentrations of anti-APO-1 for 20 hrs and apoptosis was quantified by MTS assay. (C) CAKI-1 cells transfected as in B were treated with 1 μg/ml anti-APO-1 and 1 μg/ml cycloheximide for 20 hrs. (D). Cells with increased or reduced levels of miR-200 were treated with 2 μg/ml of staurosporine for 20 hrs and cell death was quantified by MTS assay. Asterisks indicate p-values * p<0.05, ** p<0.01, *** p<0.001. Note: different CD95 stimuli were used in the assays shown in A-C because Type I cells are not sensitive to sCD95L, and Type II cells are not sensitive to non-crosslinked anti-APO-1 (Algeciras-Schimnich et al., 2003). The horizontal bars in B represent the mean. Values in graphs A, B and D represent the mean −/+ s.d. from three independent experiments.
Figure 2
Figure 2. FAP-1 Is Expressed in Mesenchymal Cells
(A) Schematic diagram of the 3′UTR of FAP-1 with the location of the putative miR-200b,c/429 target site. (B) Relative expression of FAP-1 protein in epithelial and mesenchymal cells among the NCI60 cells. (C,D) Correlation between expression level of miR-200c (% of max) (C) or let-7d (D) and FAP-1 protein in the NCI60 cells. Expression values were transformed to rank values in both axes, and red straight lines indicate linear regression for transformed rank values. Rho = Spearman Rank Correlation Coefficients between miRNAs and FAP-1 expression, and p values are given. (E) Detection of FAP-1 and E-cadherin by Western blot analysis of CAKI-1 and ACHN cells infected with lentiviruses expressing control shRNA or shRNAs for FAP-1. β-actin was detected to demonstrate equal loading. (F) Real-time PCR analysis of FAP-1 and E-cadherin in CAKI-1 cells expressing control shRNA or FAP-1 shRNAs relative to expression of GAPDH. Values in the graph in F represent the mean −/+ s.d. from three independent experiments.
Figure 3
Figure 3. Identification of FAP-1 as a Target of miR-200c
(A) ACHN, CAKI-1 and SKOV3ip cells were transfected with scrambled pre-miRNA or pre-miR-200c. HCT116 cells were serially treated seven times with LNA scrambled or LNA200. Expression of FAP-1 and E-cadherin was determined by Western blot analysis. (B) HCT116 cells were transfected as in A. FAP-1 mRNA level was determined by semi-quantitative RT-PCR. Actin mRNA was determined as a control. (C) 293T cells were transfected with reporter plasmids containing the 3′UTR of FAP-1 (psiCHECK 3′UTR FAP-1wt) or its corresponding mutant (psiCHECK 3′UTR FAP-1mut) together with either 1 pmol of pre-miRNA-scrambled or pre-miR-200c. Reporter plasmids with a fragment of the 3′UTR of ZEB2 (harboring sites 4, 5 and 6 of the seven mir-200 sites found in the full length) and its mutant (Park et al., 2008) were used as positive controls. Renilla luciferase activity was normalized to firefly luciferase activity. (D) IGROV-1 (miR-200 low) and HCT116 (miR-200 high) cells were transfected with reporter plasmid psiCHECK 3′UTR FAP-1. (E) IGROV-1 cells were transfected with psiCHECK 3′UTR FAP-1wt or its mutant together with 1 pmol of scrambled pre-miRNA, pre-miR-200a or pre-miR-200c. HCT116 cells were transfected with the same reporter plasmids together with 50 nM of LNA scrambled or LNA-200 oligos. * p<0.05, ** p<0.001. Values in C, D and E represent the mean −/+ s.d. from three independent experiments.
Figure 4
Figure 4. Targeting of FAP-1 by miR-200c Regulates Sensitivity to CD95-induced Apoptosis
(A) HCT116 cells infected with control shRNA or FAP-1 shRNA#2 were serially treated seven times with scrambled LNA or LNA-200. Cells were stimulated with different concentration of sCD95L and apoptosis was measured by MTS assay. (B) Real-time PCR analysis of FAP-1, E-cadherin, ZEB1, and ZEB2 in HCT116 cells. The insert shows a Western blot analysis of the same experiment. (C) Flow cytometric analysis of surface CD95 expression of cells with increased or reduced miR-200. Scrambled oligo or miR-200c was introduced in ACHN, CAKI-1, HeyA8, and SF295 cells either transiently or stably. For HCT116 cells, cells were serially treated seven times with scrambled LNA or LNA-200. Percentage of CD95 positivity and mean fluorescence intensity (MFI) were determined. S.D., standard deviation. Values in A and B represent the mean −/+ s.d. from three independent experiments.

References

    1. Algeciras-Schimnich A, Pietras EM, Barnhart BC, Legembre P, Vijayan S, Holbeck SL, Peter ME. Two CD95 tumor classes with different sensitivities to antitumor drugs. Proc Natl Acad Sci U S A. 2003;100:11445–11450. - PMC - PubMed
    1. Bartel DP. MicroRNAs: target recognition and regulatory functions. Cell. 2009;136:215–233. - PMC - PubMed
    1. Christoffersen NR, Silahtaroglu A, Orom UA, Kauppinen S, Lund AH. miR-200b mediates post-transcriptional repression of ZFHX1B. Rna. 2007;13:1172–1178. - PMC - PubMed
    1. Cochrane DR, Spoelstra NS, Howe EN, Nordeen SK, Richer JK. MicroRNA-200c mitigates invasiveness and restores sensitivity to microtubule-targeting chemotherapeutic agents. Mol Cancer Ther 2009 - PMC - PubMed
    1. Elnemr A, Ohta T, Yachie A, Kayahara M, Kitagawa H, Fujimura T, Ninomiya I, Fushida S, Nishimura GI, Shimizu K, Miwa K. Human pancreatic cancer cells disable function of Fas receptors at several levels in Fas signal transduction pathway. Int J Oncol. 2001;18:311–316. - PubMed

Publication types