

Altered mitochondrial membrane potential, mass, and morphology in the mononuclear cells of humans with type 2 diabetes
- PMID: 20621033
- PMCID: PMC2904361
- DOI: 10.1016/j.trsl.2010.04.001
Altered mitochondrial membrane potential, mass, and morphology in the mononuclear cells of humans with type 2 diabetes
Abstract
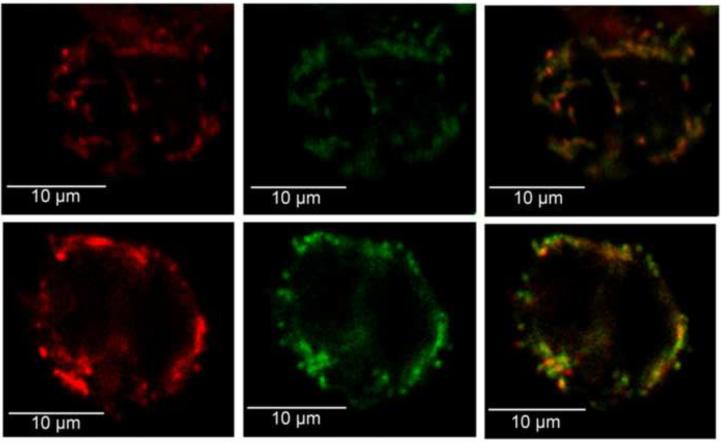
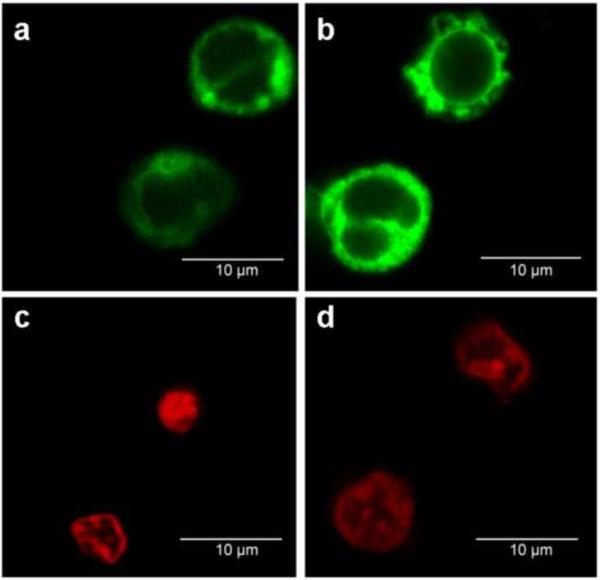
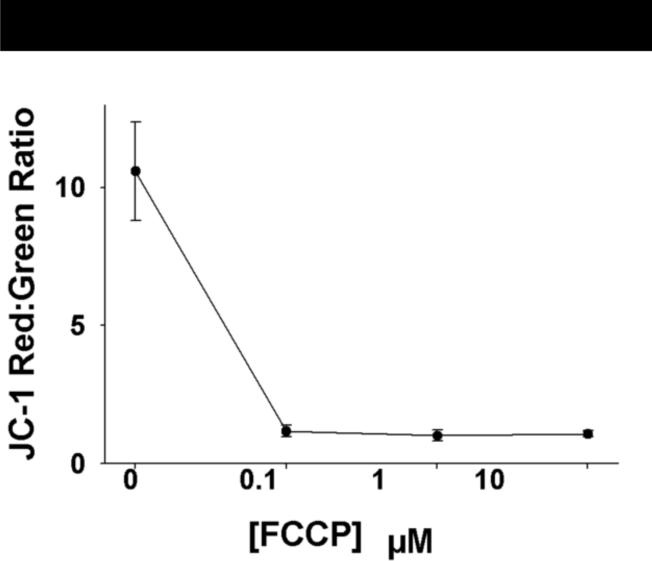
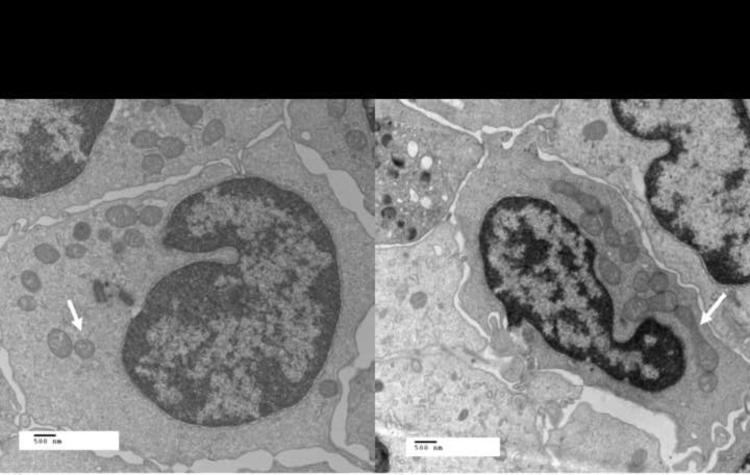
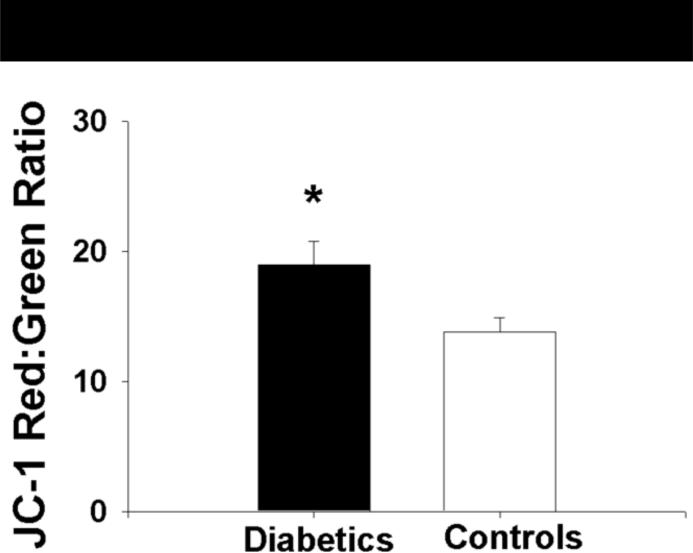
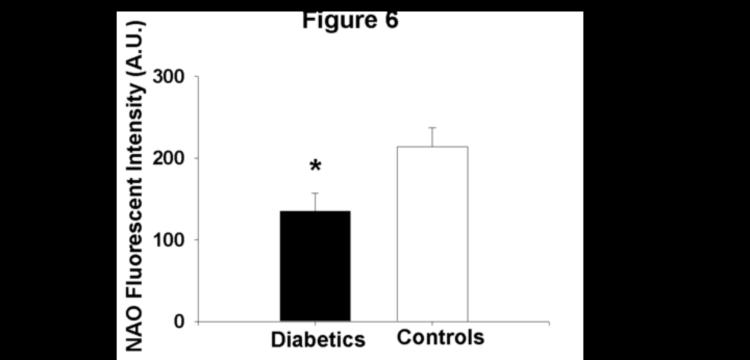
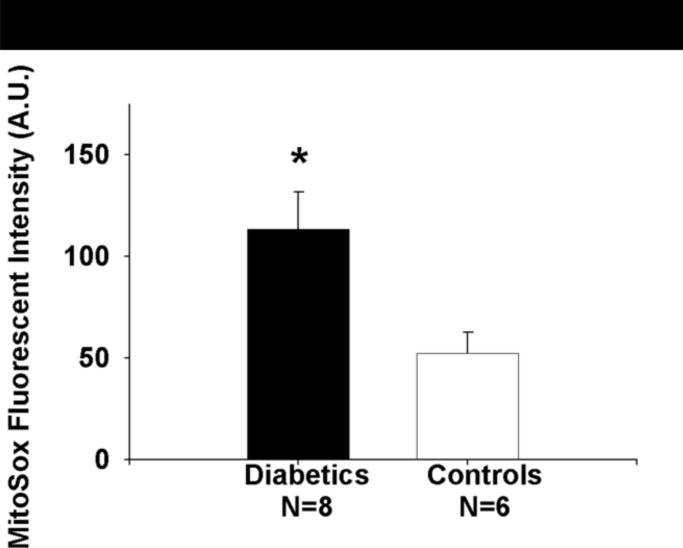
Mitochondrial membrane hyperpolarization and morphologic changes are important in inflammatory cell activation. Despite the pathophysiologic relevance, no valid and reproducible method for measuring mitochondrial homeostasis in human inflammatory cells is available currently. The purpose of this study was to define and validate reproducible methods for measuring relevant mitochondrial perturbations and to determine whether these methods could discern mitochondrial perturbations in type 2 diabetes mellitus (T2DM), which is a condition associated with altered mitochondrial homeostasis. We employed 5,5',6,6'-tetrachloro-1,1'3,3'-tetraethylbenzamidazol-carboncyanine (JC-1) to estimate mitochondrial membrane potential (Psi(m)) and acridine orange 10-nonyl bromide (NAO) to assess mitochondrial mass in human mononuclear cells isolated from blood. Both assays were reproducible. We validated our findings by electron microscopy and pharmacologic manipulation of Psi(m). We measured JC-1 and NAO fluorescence in the mononuclear cells of 27 T2DM patients and 32 controls. Mitochondria were more polarized (P = 0.02) and mitochondrial mass was lower in T2DM (P = 0.008). Electron microscopy demonstrated diabetic mitochondria were smaller, were more spherical, and occupied less cellular area in T2DM. Mitochondrial superoxide production was higher in T2DM (P = 0.01). Valid and reproducible measurements of mitochondrial homeostasis can be made in human mononuclear cells using these fluorophores. Furthermore, potentially clinically relevant perturbations in mitochondrial homeostasis in T2DM human mononuclear cells can be detected.
Copyright 2010 Mosby, Inc. All rights reserved.
Figures
References
-
- Brownlee M. Biochemistry and molecular cell biology of diabetic complications. Nature. 2001 December 13;414(6865):813–20. - PubMed
-
- Liuzzo G. Perturbation of the T-cell repertoire in patients with unstable angina. Circulation. 1999;100:2135–9. - PubMed
-
- Liuzzo G, Goronzy JJ, Yang H, et al. Monoclonal T-cell proliferation and plaque instability in acute coronary syndromes. Circulation. 2000 June 27;101(25):2883–8. - PubMed
-
- Berdowska A, Zwirska-Korczala K. Neopterin measurement in clinical diagnosis. J Clin Pharm Ther. 2001 October;26(5):319–29. - PubMed
-
- Libby P, Ridker PM, Maseri A. Inflammation and atherosclerosis. Circulation. 2002 March 5;105(9):1135–43. - PubMed
Publication types
MeSH terms
Substances
Grants and funding
- K23HL089326/HL/NHLBI NIH HHS/United States
- R01 HL075795/HL/NHLBI NIH HHS/United States
- HL094971/HL/NHLBI NIH HHS/United States
- T32 HL007792/HL/NHLBI NIH HHS/United States
- AT002034/AT/NCCIH NIH HHS/United States
- HL081587/HL/NHLBI NIH HHS/United States
- P50 HL055993/HL/NHLBI NIH HHS/United States
- P50 HL083801/HL/NHLBI NIH HHS/United States
- R01 HL083269/HL/NHLBI NIH HHS/United States
- R01 HL113612/HL/NHLBI NIH HHS/United States
- R01 HL080704/HL/NHLBI NIH HHS/United States
- HL083801/HL/NHLBI NIH HHS/United States
- P01 HL081587/HL/NHLBI NIH HHS/United States
- P01 HL060886/HL/NHLBI NIH HHS/United States
- HL080704/HL/NHLBI NIH HHS/United States
- T32 HL007792-15/HL/NHLBI NIH HHS/United States
- P01 AT002034/AT/NCCIH NIH HHS/United States
- R01 AG017141/AG/NIA NIH HHS/United States
- K23 HL089326/HL/NHLBI NIH HHS/United States
- K12 HL083781/HL/NHLBI NIH HHS/United States
- R01 HL094971/HL/NHLBI NIH HHS/United States
- HL75795/HL/NHLBI NIH HHS/United States
- HL083269/HL/NHLBI NIH HHS/United States
- AG017141/AG/NIA NIH HHS/United States
- R01 HL089779/HL/NHLBI NIH HHS/United States
LinkOut - more resources
Full Text Sources
Medical
