

Editorial
doi: 10.7326/0003-4819-153-1-201007060-00012.
Aggregating and disaggregating patients in clinical trials and their subgroup analyses
- PMID: 20621903
- PMCID: PMC2946839
- DOI: 10.7326/0003-4819-153-1-201007060-00012
Item in Clipboard
Editorial
Aggregating and disaggregating patients in clinical trials and their subgroup analyses
Ann Intern Med.
.
No abstract available
Figures
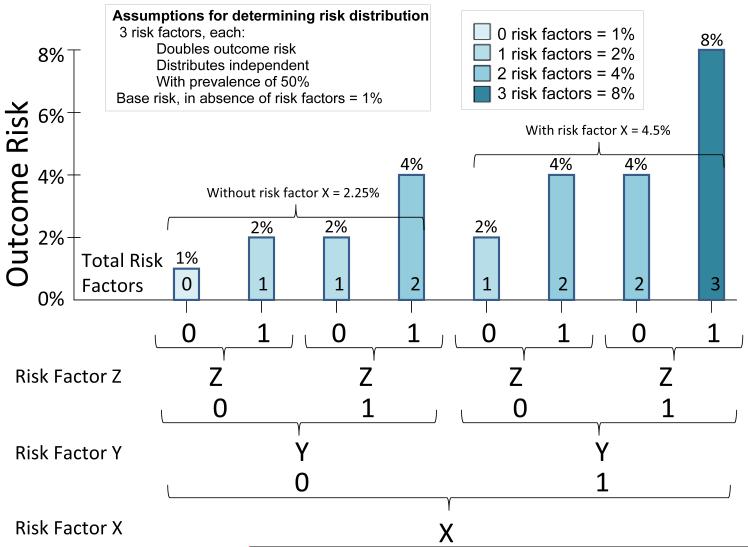
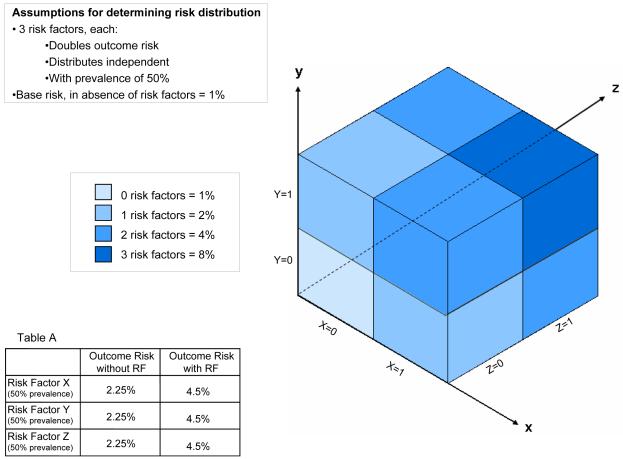
The risk distribution illustrated in the figure is generated from the simple assumptions described, and averages 3.4% for the population overall (i.e. based on the arithmetic mean across the subgroups). As illustrated, any subgroup (i.e. those with risk factor X or risk factor y or risk factor z comprised of patients with any one risk factor will have an outcome-risk of 4.5%--suggesting a benefit for 7 out of 8 patients. This is true even though within any of these “high risk” subgroups, ¾ of patients have risks lower than this average. More paradoxically, the average outcome-risk for patients with any risk factor in aggregate is only 3.7%. A risk-stratified analysis, which makes use of the 3 variables simultaneously, would demonstrate that only the highest risk 1/8 of patients would benefit from therapy.
The risk distribution illustrated in the figure is generated from the simple assumptions described, and averages 3.4% for the population overall (i.e. based on the arithmetic mean across the subgroups). As illustrated, any subgroup (i.e. those with risk factor X or risk factor y or risk factor z comprised of patients with any one risk factor will have an outcome-risk of 4.5%--suggesting a benefit for 7 out of 8 patients. This is true even though within any of these “high risk” subgroups, ¾ of patients have risks lower than this average. More paradoxically, the average outcome-risk for patients with any risk factor in aggregate is only 3.7%. A risk-stratified analysis, which makes use of the 3 variables simultaneously, would demonstrate that only the highest risk 1/8 of patients would benefit from therapy.
Comment on
-
Extended-duration venous thromboembolism prophylaxis in acutely ill medical patients with recently reduced mobility: a randomized trial.Ann Intern Med. 2010 Jul 6;153(1):8-18. doi: 10.7326/0003-4819-153-1-201007060-00004. Ann Intern Med. 2010. PMID: 20621900 Clinical Trial.
References
-
- Hull RD, Schellong SM, Tapson VF, Monreal M, Samama M, Nicol P, et al. Extended-Duration Venous Thromboembolism Prophylaxis in Acutely Ill Medical Patients with Recent Reduced Mobility: A randomized, controlled trial. Annals of Internal Medicine. 2010 In press. - PubMed
-
- Kent DM, Hayward RA. Limitations of applying summary results of clinical trials to individual patients: the need for risk stratification. JAMA. 2007;298:1209–12. - PubMed
-
- Sun X, Briel M, Walter SD, Guyatt GH. Is a subgroup effect believable? Updating criteria to evaluate the credibility of subgroup analyses. BMJ. 2010;340:c117. - PubMed
Publication types
MeSH terms
Substances
Grants and funding
LinkOut - more resources
Full Text Sources
Medical