Meta-Analysis
. 2010 Nov;38(20):7008-21.
doi: 10.1093/nar/gkq574. Epub 2010 Jul 9.

Meta-analysis of cancer gene expression signatures reveals new cancer genes, SAGE tags and tumor associated regions of co-regulation

Affiliations
Meta-Analysis

Meta-analysis of cancer gene expression signatures reveals new cancer genes, SAGE tags and tumor associated regions of co-regulation

Ersen Kavak et al. Nucleic Acids Res. 2010 Nov.

Abstract

Cancer is among the major causes of human death and its mechanism(s) are not fully understood. We applied a novel meta-analysis approach to multiple sets of merged serial analysis of gene expression and microarray cancer data in order to analyze transcriptome alterations in human cancer. Our methodology, which we denote 'COgnate Gene Expression patterNing in tumours' (COGENT), unmasked numerous genes that were differentially expressed in multiple cancers. COGENT detected well-known tumor-associated (TA) genes such as TP53, EGFR and VEGF, as well as many multi-cancer, but not-yet-tumor-associated genes. In addition, we identified 81 co-regulated regions on the human genome (RIDGEs) by using expression data from all cancers. Some RIDGEs (28%) consist of paralog genes while another subset (30%) are specifically dysregulated in tumors but not in normal tissues. Furthermore, a significant number of RIDGEs are associated with GC-rich regions on the genome. All assembled data is freely available online (www.oncoreveal.org) as a tool implementing COGENT analysis of multi-cancer genes and RIDGEs. These findings engender a deeper understanding of cancer biology by demonstrating the existence of a pool of under-studied multi-cancer genes and by highlighting the cancer-specificity of some TA-RIDGEs.


Figures

Figure 1.
Figure 1.
Study design.
Figure 2.
Figure 2.
Verification of oncoreveal predictions in an independent panel of tumor and non-tumor brain samples. Verification of nine selected NYTA downregulated multi-cancer genes by RT–PCR. Verification of three selected NYTA upregulated multi-cancer genes is presented at Supplementary Table S1. The corresponding COGENT analysis for these genes is presented at Supplementary Table S5. DNET: Dysmbryoplastic NeuroEpithelial Tumor.
Figure 3.
Figure 3.
Multi-cancer genes. (A) Multi-cancer genes are more likely to have been studied and have cancer annotations. X axis indicates gene sets which are altered in more than a certain number of cancer types. Y axis indicates either FDR percentage or minus log P-value of the geneRIF enrichment. We used only those genes which were common to all platforms in this analysis. (B) Rank of a gene’s expression change (in a single cancer-normal comparison) decreases with the number of cancer types it is over-expressed in. To define rank, each cancer-normal comparison data set is sorted by P-value for microarray data and first by P-value and then fold value for SAGE data. The minimum rank (highest change) of a gene was considered when multiple probesets mapped to a single gene. T-value is Kendall Tau B correlation coefficient between X axis values and means of each subgroup in the Y axis (P = 0.00024). Highly significant but smaller correlation exists when all data points rather than means are considered (T = − 0.09, P = 6e − 41). We used only those genes which were common to all platforms in this analysis. The expected distributions in B and D are the randomly shuffled versions of the observed values to control for the within group sample size effect, if any. (C) Rank of a gene’s expression change in a single cancer type explains being associated with cancer. Ranks of the TA and not yet TA genes are significantly different for most of the X axis values (no. of cancer types), and when the data is not sub-divided by the X axis (P < 0.000000, Mann–Whitney U-test; data not shown). All genes are used in the analysis. (D) Over-expressed multi-cancer genes have more orthologs (homologs in different species). T-value is Kendall Tau B correlation coefficient between X axis values and means of each subgroup on the Y axis (P = 0.025). A significant but smaller correlation exists when all data points rather than means are considered (T = 0.06, P = 1.46e – 05). We used only those genes which were common to all platforms in this analysis. *P < 0.05, **P < 0.01, ***P < 0.005. P-values are of two independent samples t-test. In all of the graphs, the point markers are means of the data, and the error bars indicate standard error.
Figure 4.
Figure 4.
Overview and close up of TA-RIDGEs and NA-RIDGEs by using gene neighborhood correlation score. (A) Two representative chromosomes (upper—chr1; lower—chr17) which summarize the overall appearance of TA-RIDGEs and corresponding gene neighborhood correlation scores (average of Rs with ± 21 neighboring genes) with normal variation expression matrix. Darker dots were identified as being member of a TA-RIDGE by the ICEBERG algorithm. The TA-RIDGEs were named by using the chromosome they reside in and the leftmost member of the TA-RIDGE. Dashed lines represent the secondary P-value cut-off and primary P-value cut-off respectively from low to high in the Y axis. X axis represents position in megabases (MB). (B) Six representative TA-RIDGEs. Axes are as in (A). Family gene % (percentage of genes which have at least one family member in the same RIDGE) and normal co-regulation % (the % of genes at a TA-RIDGE that score above the P 0.05 threshold at the corresponding region from the normal variation expression matrix) are shown under each TA-RIDGE. Chr5_PCDHAC1, Chr17_Krt25 are examples of family gene dense TA-RIDGEs, which comprise 28% of all TA-RIDGEs. Chr16_HBQ1 is a non-family RIDGE which is common to cancer and normal context. chr7_C7orf28A and chr7_SSPO are two examples of cancer specific TA-RIDGEs, which comprise 40% of all TA-RIDGEs. Almost the entire chromosome Y is co-regulated among normal tissues and also in cancer and identified as one TA-RIDGE: chrY-RPS4Y1.
Figure 4.
Figure 4.
Continued.
Figure 5.
Figure 5.
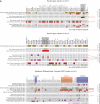
Regulation of Keratin, SPRR and S100A gene families in skin cancer and melanoma metastasis. (A) There are two large keratin TA-RIDGEs on the genome on chr12 and chr17 almost all of which are down-regulated in squamous cell and basal cell skin cancer when compared to normal skin. However; KRT5, KRT6A, KRT6B and KRT6C (on chr12, shaded gray) and KRT14, KRT16 and KRT17 (on chr17, shaded gray) are up-regulated in SCSC and four of them are also upregulated in basal cell skin cancer. The TA-RIDGE which corresponds to the EDC that contains SPRRs (shaded red) and S100As (shaded blue) is mostly upregulated in both types of NMSC. All three gene families are over-expressed in chronic phase CML as well. Different colors represent different tumors. Each colored box represents differential expression with the merged COGENT data set (Q < 0.05 for microarray, P < 0.02 for SAGE). Light gray boxes represent non-differential expression. Cross-dashed boxes represent missing data. Cancers are sorted by the fold enrichment of differential expression over the expected random differential expression, as explained in Supplementary Data. Fold enrichment values are stated in parentheses beside the tumor names. Only cancers that are significantly (randomization based test: P < 0.01) enriched for differential expression are shown. The arcs between rows represent significant co-differential expression events (red arcs: P < 0.001, black arcs: P < 0.002). Cancers are divided into two by the presence or absence of a significant co-regulation with another cancer. Genes annotated with *** are significantly (P < 0.05) co-regulated with the neighbors. Close-ups of RIDGEs with different filters can be visualized at www.oncoreveal.org. (B) SPRR genes, S100A genes and Keratin genes which are over-expressed in SCSC (red squares in A) are among the top down-regulated genes in melanoma metastasis samples when compared to primary melanoma samples. Each bar in the bar graph represents the fold change between average expression values of two classes. Error bars represent the average of standard deviations over all possible fold changes between two classes divided by size of all possible comparisons. ***P < 0.001 by Mann–Whitney U test. Inset: distribution of fold changes presented in the main graph. Boxes represent inter-quartile range. Whiskers span 1.5 times inter-quartile range.
Figure 5.
Figure 5.
Continued.
Figure 6.
Figure 6.
Online service; www.oncoreveal.org. Users can analyze COGENT SAGE, COGENT microarray & SAGE and TA-RIDGEs by using oncoreveal. Short SAGE tags or DGED results for COGENT–SAGE and Entrez Gene IDs or symbols can be used as input. Users can filter altered genes by cancer type (with any of the three different classifications) or number of cancer types in which change occurred. Several different filtering options from commonly used data sources such as gene ontology and different visualization, sorting and export options are available.

Similar articles

Cited by

References

    1. Velculescu VE, Zhang L, Vogelstein B, Kinzler KW. Serial analysis of gene expression. Science. 1995;270:484–487. - PubMed
    1. Morrissy AS, Morin RD, Delaney A, Zeng T, McDonald H, Jones S, Zhao Y, Hirst M, Marra MA. Next-generation tag sequencing for cancer gene expression profiling. Genome Res. 2009;19:1825–1835. - PMC - PubMed
    1. Rhodes DR, Yu J, Shanker K, Deshpande N, Varambally R, Ghosh D, Barrette T, Pandey A, Chinnaiyan AM. Large-scale meta-analysis of cancer microarray data identifies common transcriptional profiles of neoplastic transformation and progression. Proc. Natl Acad. Sci. USA. 2004;101:9309–9314. - PMC - PubMed
    1. Xu L, Geman D, Winslow RL. Large-scale integration of cancer microarray data identifies a robust common cancer signature. BMC Bioinformatics. 2007;8:275. - PMC - PubMed
    1. Bueno-de-Mesquita JM, van Harten WH, Retel VP, van't Veer LJ, van Dam FS, Karsenberg K, Douma KF, van Tinteren H, Peterse JL, Wesseling J, et al. Use of 70-gene signature to predict prognosis of patients with node-negative breast cancer: a prospective community-based feasibility study (RASTER) Lancet Oncol. 2007;8:1079–1087. - PubMed

Publication types