. 2010 Oct 1;285(40):30884-905.
doi: 10.1074/jbc.M110.135947. Epub 2010 Jul 9.

HIV-1 Nef binds a subpopulation of MHC-I throughout its trafficking itinerary and down-regulates MHC-I by perturbing both anterograde and retrograde trafficking

Affiliations

HIV-1 Nef binds a subpopulation of MHC-I throughout its trafficking itinerary and down-regulates MHC-I by perturbing both anterograde and retrograde trafficking

Ling Yi et al. J Biol Chem. .

Erratum in

  • J Biol Chem. 2010 Dec 3;285(49):38740. Chaudhury, Bhabhadeb [corrected to Chowdhury, Bhabadeb]

Abstract

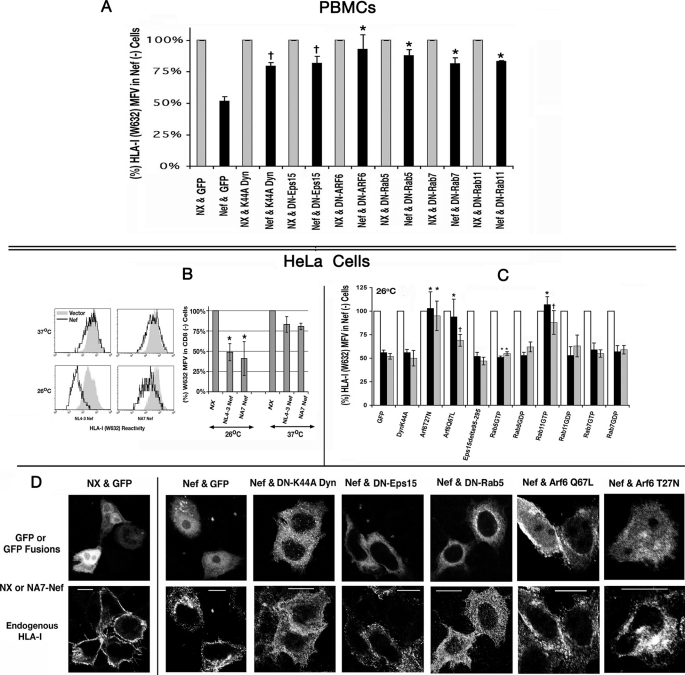
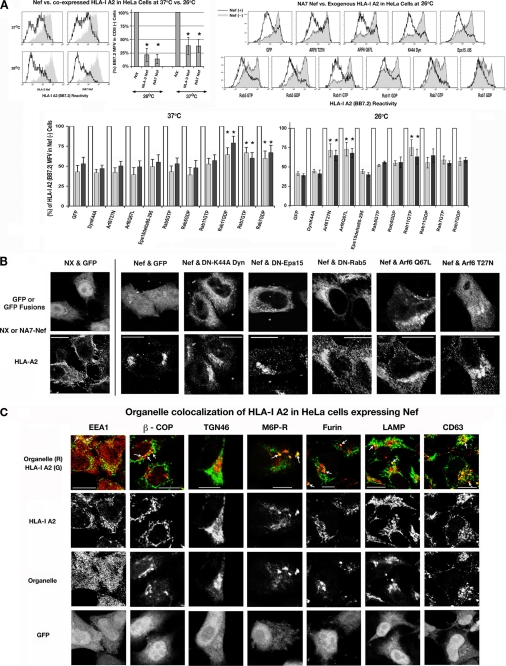
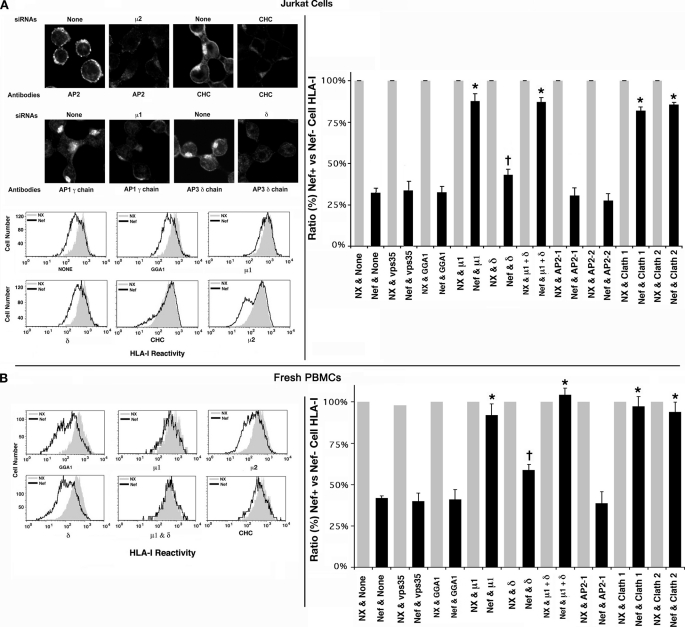
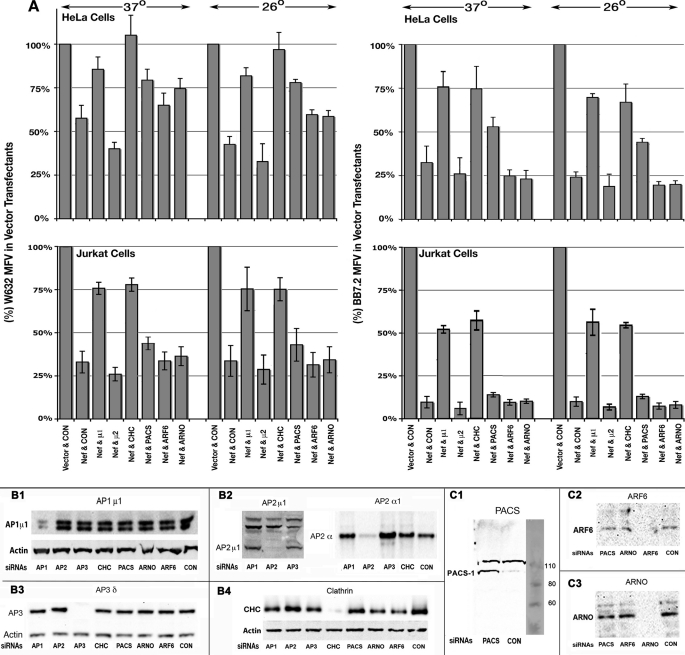
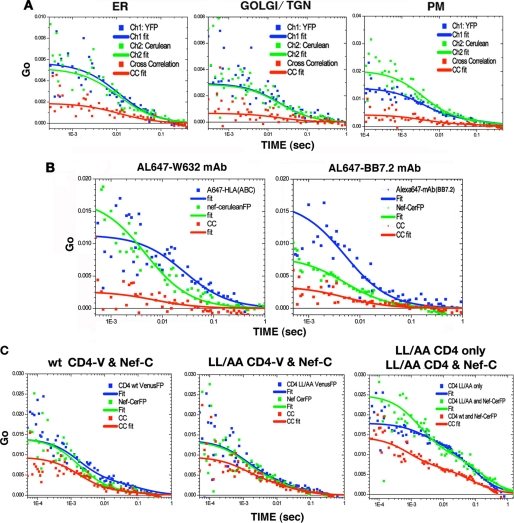
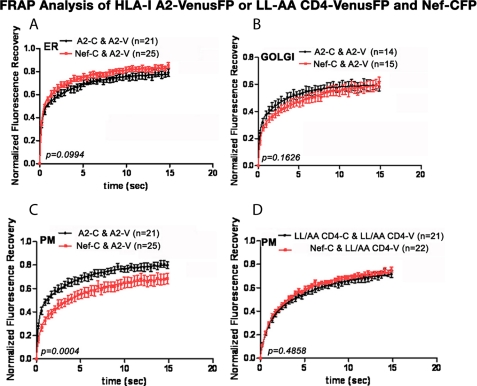
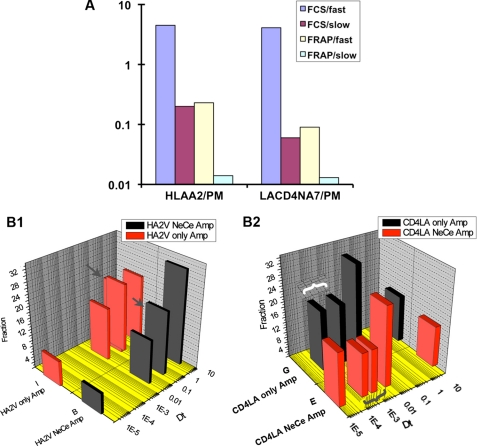
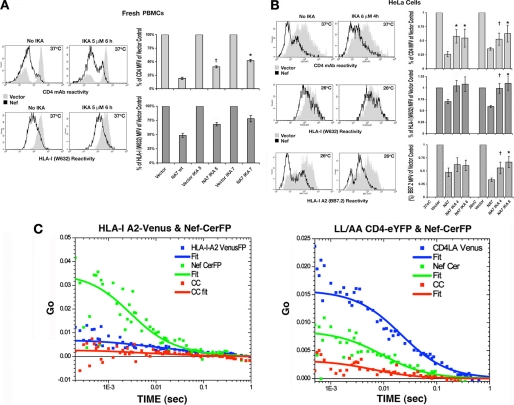
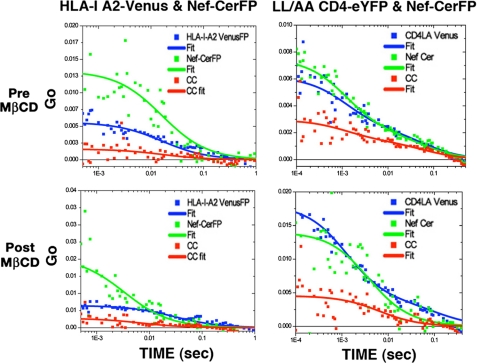
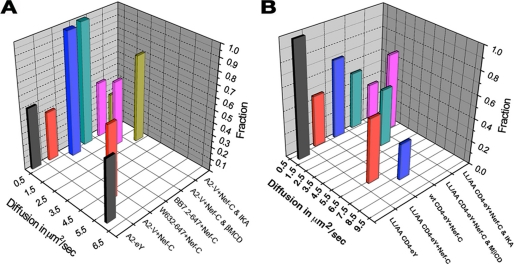
The HIV protein Nef is thought to mediate immune evasion and promote viral persistence in part by down-regulating major histocompatibility complex class I protein (MHC-I or HLA-I) from the cell surface. Two different models have been proposed to explain this phenomenon as follows: 1) stimulation of MHC-I retrograde trafficking from and aberrant recycling to the plasma membrane, and 2) inhibition of anterograde trafficking of newly synthesized HLA-I from the endoplasmic reticulum to the plasma membrane. We show here that Nef simultaneously uses both mechanisms to down-regulate HLA-I in peripheral blood mononuclear cells or HeLa cells. Consistent with this, we found by using fluorescence correlation spectroscopy that a third of diffusing HLA-I at the endoplasmic reticulum, Golgi/trans-Golgi network, and the plasma membrane (PM) was associated with Nef. The binding of Nef was similarly avid for native HLA-I and recombinant HLA-I A2 at the PM. Nef binding to HLA-I at the PM was sensitive to specific inhibition of endocytosis. It was also attenuated by cyclodextrin disruption of PM lipid micro-domain architecture, a change that also retarded lateral diffusion and induced large clusters of HLA-I. In all, our data support a model for Nef down-regulation of HLA-I that involves both major trafficking itineraries and persistent protein-protein interactions throughout the cell.


Figures

FIGURE 1.
FIGURE 1.
A, Nef-mediated clearance of innate HLA-I from the plasma membrane of quiescent PBMCs was reversed by genetic inhibitors of endocytosis. Cells were co-transfected with NL-3 Nef or an NX at a 2-fold molar excess over GFP or GFP/YFP-tagged dominant-negative inhibitors of endocytosis. HLA-I expression for G/YFP-gated cells was measured using Alexa 647-conjugated W/632 mAb. FACS histogram profile of HLA-I for Nef (black) cells is overlaid with the corresponding one for non-Nef (gray) transfectants. HLA-I MFVs of GFP (or YFP)-gated populations for the null and the Nef transfectants averaged from four experiments are plotted as histograms (with error bars) in sets of two, with the value for null Nef arbitrarily set to 100. †, n = 3, p < 0.008; *, n = 4, p < 0.008. B, innate HLA-I on HeLa cells was down-regulated by HIV-1 Nef better at 26 than at 37 °C, and this effect was reversed by certain genetic inhibitors of endocytosis. FACS histogram profiles of native HLA-I in HeLa cells co-transfected with WT Nef (NL4-3 or NA7 allele) or NX and CD8 expression plasmid. At 6 h post-transfection, cells were downshifted to 26 °C or continued at 37 °C for another 12–16 h. HLA-I profiles of vector (gray) and Nef (black) transfectants gated for CD8 are overlaid in each panel. HLA-I MFVs of CD8-gated populations in the vector and Nef transfectants at 26 or 37 °C are plotted as histograms to the right, with the vector value arbitrarily set to 100. Averaged results from four experiments are plotted with S.E. C, effect of genetic inhibitors of endocytosis. HeLa cells were co-transfected with NL-3 (black) or NA7 Nef (gray) or a null mutant (white) at a 2-fold molar excess over GFP or GFP/YFP-tagged dominant-negative inhibitors of endocytosis. After shifting the transfectants to 26 °C for 18 h, HLA-I expression for GFP/YFP-gated cells was measured using Alexa 647-conjugated W/632 mAb. HLA-I MFVs of GFP (or YFP)-gated populations for the null and the two Nef transfectants averaged from four experiments are plotted as histograms (with error bars) in sets of three, with the value for null Nef arbitrarily set to 100. †, n = 4, p < 0.008; *, n = 5, p < 0.008. D, subcellular distribution of native HLA-I in HeLa cells co-expressing Nef or NX and GFP or GFP (or YFP)-tagged effectors or inhibitors of endocytosis. HeLa cells were transfected with a 2-fold molar excess of HIV-1 Nef over GFP or GFP/YFP fusion protein plasmids. At these ratios, Nef expression was present in all the GFP/YFP + cells. At 18 h after transfection, cells were downshifted to room temperature (25 °C) for 4–6 h, rinsed, fixed in 4% paraformaldehyde, permeabilized in 0.1% Triton X-100, and stained with the Alexa 647-conjugated polytropic HLA-I mAb, W632, before processing for microscopy. Individual channels corresponding to GFP and W632 fluorescence extracted from the RGB images are shown.
FIGURE 2.
FIGURE 2.
A, in HeLa cells HIV-1 Nef down-regulated recombinant HLA-I A2 only slightly better at 26 than 37 °C, and this effect was reversed slightly by certain genetic inhibitors of endocytosis. FACS profiles (top left) of HLA-I A2 expression in HeLa cells co-transfected with plasmids expressing WT Nef (NL4-3 or NA7 allele) or vector, HLA-I A2, and CD8 (left). Conditions are as in Fig. 1B. Effect of genetic inhibitors of endocytosis. HeLa cells were co-transfected with a plasmid expressing HLA-I A2 and NL-3 (black), NA7 Nef (gray), or a null mutant (white) plasmid at a 2-fold molar excess over GFP or GFP/YFP-tagged dominant-negative inhibitors of endocytosis. Average A2 MFVs of null and Nef transfectants at 37 and 26 °C are plotted as histograms with error bars as in B. *, n = 4, p < 0.01. B, subcellular distribution of HLA-I A2 in HeLa cells co-expressing Nef and GFP or GFP/YFP-tagged effectors or inhibitors of endocytosis. Conditions are as described for Fig. 1D except for the use of HLA-I A2-specific BB7.2 mAb. C, co-localization of HLA-I A2 and Nef with various subcellular organelles in HeLa cells. HeLa cells were transfected with an HLA-I A2 IRES GFP bicistronic vector. HLA-I A2 was stained with Alexa 647-conjugated BB7.2 mAb. β-COP, EEA-1, clathrin, furin, and mannose 6-phosphate receptor (M6P-R) were detected with the respective rabbit antisera, TGN with sheep anti-TGN 46, and LAMP and CD63 with the respective murine mAbs followed by secondary staining with Alexa 568-conjugated anti-rabbit, -sheep, or -mouse IgGs, respectively. Individual channels corresponding to HLA-I A2, the respective organelle, and GFP fluorescence extracted from the RGB images are shown below composite pictographs of HLA-I A2 in green and organelle in red. Scale bars, 10 μm.
FIGURE 3.
FIGURE 3.
A, Nef-induced down-regulation of native HLA-I was reversed by siRNA knockdown of AP1 subunits or CHC in Jurkat cells and quiescent PBMCs. A, selected subsets (Mock, AP1 μ1a, AP2 μ2, AP3 δ, or CHC siRNA-transfected) of Jurkat cells were analyzed by immunofluorescence microscopy using antibodies against AP1 γ chain, AP2 α chain, AP3 δ chain, or CHC (top left). Following siRNA knockdown, cells were transfected with bicistronic plasmids encoding GFP and Nef or NX mutant. Relative HLA-I MFVs for GFP-gated cells are plotted pairwise for Nef(+) and Nef(−) cells, with the latter values arbitrarily assigned 100% in each pair. FACS histogram profiles of HLA-I for selected siRNA transfectants. MFVs for NL4-3 Nef (black) expressers are overlaid with the corresponding one for the non-Nef (gray) cells (bottom left). HLA-I MFVs of CD8-gated populations for the null (gray) and the Nef expressers (in the context of siRNA knockdown) averaged from four experiments are plotted pairwise as histograms (with error bars) in sets of three, with the value for null Nef arbitrarily set to 100 (right). B, effect of siRNA knockdown on Nef-induced HLA-I down-regulation in PBMCs. FACS histogram profiles of HLA-I for selected siRNA transfectants are gated for GFP expression (left). Average HLA-I MFVs plotted pairwise (with error bars) for null and Nef expressers in the context siRNA induced knockdown. †, n = 3, p < 0.03, and *, n = 3, p < 0.005 for the indicated siRNAs versus none in Nef(+) cells.
FIGURE 4.
FIGURE 4.
A, differential HLA-I response to Nef in Jurkat versus HeLa cells in the context of siRNA knockdown of vesicular adapter proteins, clathrin, PACS-1, Arf6, and ARNO. A, histograms showing average MFVs (with error bars) of native HLA-I (left) or plasmid-expressed A2 allele (right) in HeLa (top) or Jurkat (bottom) cells expressing Nef in the context of siRNA knockdown of the indicated proteins. Jurkat or HeLa cells were transfected for 36 h with the respective siRNAs twice before co-transfection with Nef or NX (vector) plasmid with one expressing CD8, CD4, and/or HLA-I A2 expression plasmid(s) and incubated at 37 or 26 °C for 18–24 h. ‡, n = 4, p < 0.04; †, n = 4, p < 0.02; *, n = 4, p < 0.008 for the indicated siRNA knockdowns versus no siRNA (CON) in Nef(+) cells. B1–C3, approximately 2 × 10⁶ (HeLa or Jurkat) cells were disrupted in 0.5 ml of lysis buffer, and initially 50 μl of 15,000 × g supernatants were immunoblotted for actin. After adjusting the volume to constant actin values, the indicated vesicular or adapter proteins were detected by immunoblotting extracts of cells treated with the siRNAs listed below the respective blots, using rabbit antibody against AP1 μ1 chain (B1) and AP2 μ and murine mAbs against AP2 α chain (B2), AP3 δ chain (B3), clathrin heavy chain (B4), rabbit antiserum against PACS-I (C1), and murine mAbs against Arf6 (C2) and ARNO (C3).
FIGURE 5.
FIGURE 5.
A, single point FCCS data acquisition from ER, Golgi/TGN, and PM loci. Transfections were done at 26 °C for 4 h using 0.5 μg each of HLA-A2 or CD4 and Nef fusion plasmids per 105 cells on each of 2-well Titer-Tek culture chambers. ER was visualized by staining with BODIPY Texas Red-conjugated glibencamide, Golgi/TGN with BODIPY Texas Red-conjugated ceramide, and PM with Texas Red-conjugated wheat germ agglutinin, all of which were excited at 840 nm, although HLA-I A2-V and Nef-C were detected by excitation at 920 nm. ACF profiles for Nef-C in green, A2-V in blue, and cross-correlation (CC) in red are shown on the right panels of each row (100 × 100 μm). B, auto- and cross-correlation plots of Alexa 647-conjugated W632 (left) or BB7.2 (right) mAb specific for native HLA-I or the plasmid expressed A2 allele, respectively, in the context of Nef-C expression in the respective cells. C, ACF (CD4 in blue and Nef in green) and CCF (red) profiles in cells co-expressing WT or LL/AA CD4-V and Nef-C are shown in the left and middle panels, respectively. Changes in diffusion rates of WT or LL/AA CD4 in the presence of Nef were deduced by comparing the CD4 ACF profile of LL/AA CD4 only (blue), LL/AA CD4 and Nef (green), and WT CD4 and Nef (red), right panel. Note that the diffusion coefficient changes leftward from something very large to somewhat smaller.
FIGURE 6.
FIGURE 6.
Effect of Nef on the FRAP recoveries of HLA-I A2 in the ER (A), the Golgi (B), and the plasma membrane (C) are shown. The corresponding curve fits of FRAP data for the LL/AA CD4 mutant at the plasma membrane are shown in D. Experimental condition as are detailed under “Experimental Procedures.”
FIGURE 7.
FIGURE 7.
A, comparison of parameters obtained by FCCS versus FRAP for the PM interactions of HLA-I A2-Venus or LL/AA CD4-eY/Venus with Nef-CerFP. The slow component from FCCS was comparable with the fast component seen in FRAP. Diffusion coefficients were obtained from FCCS and FRAP analysis of HLA-I A2-eY/V (B1) and LL/AA CD4-eY. B2, consolidation of FCCS and FRAP data. The FRAP data were normalized to the slow component of the FCCS data. If only one component was identified in the FCCS analysis, then FRAP data were normalized to this Dt. Immobile fraction has been plotted with a Dt of 1e−5 due to the log scale constraint. Arrow (B1) and braces (B2) denote the FRAP/FCCS coefficient(s) that were normalized and have the same “height.” They could be thought as a single component.
FIGURE 8.
FIGURE 8.
Inhibition of clathrin-dependent endocytosis partially reversed Nef-induced down-regulation of native HLA-I. A, FACS histogram profiles of CD4, innate HLA-I, and recombinant HLA-I A2 in HeLa cells co-transfected with plasmids expressing WT Nef (NL4-3 or NA7 allele) or NX (vector), HLA-I A2, and CD8 with (right) or without (left) IKA treatment at 6 μm for 4 h. Receptor MFV profiles of vector (gray) and Nef (black) transfectants gated for CD8 are overlaid in each panel. CD4 results were at 37 °C and HLA-I results were at 26 °C. Histograms on the right show average (n = 4 or 5) expression profiles (with error bars) of native CD4 and HLA-I or recombinant HLA-I A2 in Jurkat cells transfected with vector or Nef plasmid with or without 5 μm IKA treatment for 4 h. B, FACS histogram profiles of CD4 (top) or HLA-I (bottom) in quiescent PBMCs expressing Nef or no Nef (vector), treated with (right) or without (left) 5 μm IKA for 4 h at 37 °C. MFV profiles of vector (gray) and Nef (black) transfectants gated for CD8 are overlaid in each panel. The statistical histograms (with error bars) to the right of each set of FACS profiles represent average (n = 4) MFV results at 37 and 26 °C with 4 and 6 μm IKA for HeLa cells or and 7 μm IKA for PBMCs. †, n = 4, p < 0.03, and *, n = 4, p < 0.01, for IKA-treated versus untreated Nef(+) cells. C, auto- and cross-correlation profiles of IKA (5 μm for 4 h at 26 °C)-treated cells. ACFs were determined at single points on the membrane.
FIGURE 9.
FIGURE 9.
Cholesterol depletion disrupts the association of Nef with HLA-I A2 (left) or LL/AA CD4 (right) at the PM. The ACFs (receptor in blue and Nef in red) and CCFs (red) data points were obtained at single points on the membrane before or after MβCD extraction.
FIGURE 10.
FIGURE 10.
A, diffusion coefficients and relative abundance of HLA-I Nef complexes. A2-V refers to HLA-I-A2-Venus fusion protein; BB7.2-647 denotes Alexa 647-conjugated BB7.2 mAb used to detect recombinant HLA-I-A2 at the PM, and W632-647 refers to Alexa 647-conjugated W632 mAb used to detect native HLA-I at the PM. B, diffusion coefficients and relative abundance of each fraction are plotted for CD4 (WT or L413A/L414A mutant) FCCS measurements.

Similar articles

Cited by

References

    1. Collins K. L., Baltimore D. (1999) Immunol. Rev. 168, 65–74 - PubMed
    1. Garcia J. V., Miller A. D. (1991) Nature 350, 508–511 - PubMed
    1. Schwartz O., Maréchal V., Le Gall S., Lemonnier F., Heard J. M. (1996) Nat. Med. 2, 338–342 - PubMed
    1. Sol-Foulon N., Moris A., Nobile C., Boccaccio C., Engering A., Abastado J. P., Heard J. M., van Kooyk Y., Schwartz O. (2002) Immunity 16, 145–155 - PubMed
    1. Stumptner-Cuvelette P., Morchoisne S., Dugast M., Le Gall S., Raposo G., Schwartz O., Benaroch P. (2001) Proc. Natl. Acad. Sci. U.S.A. 98, 12144–12149 - PMC - PubMed

Publication types

MeSH terms

Substances