Negative regulation of meiotic gene expression by the nuclear poly(a)-binding protein in fission yeast
- PMID: 20622014
- PMCID: PMC2934653
- DOI: 10.1074/jbc.M110.150748
Negative regulation of meiotic gene expression by the nuclear poly(a)-binding protein in fission yeast
Abstract
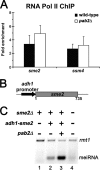
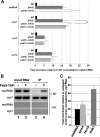
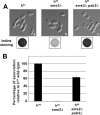
Meiosis is a cellular differentiation process in which hundreds of genes are temporally induced. Because the expression of meiotic genes during mitosis is detrimental to proliferation, meiotic genes must be negatively regulated in the mitotic cell cycle. Yet, little is known about mechanisms used by mitotic cells to repress meiosis-specific genes. Here we show that the poly(A)-binding protein Pab2, the fission yeast homolog of mammalian PABPN1, controls the expression of several meiotic transcripts during mitotic division. Our results from chromatin immunoprecipitation and promoter-swapping experiments indicate that Pab2 controls meiotic genes post-transcriptionally. Consistently, we show that the nuclear exosome complex cooperates with Pab2 in the negative regulation of meiotic genes. We also found that Pab2 plays a role in the RNA decay pathway orchestrated by Mmi1, a previously described factor that functions in the post-transcriptional elimination of meiotic transcripts. Our results support a model in which Mmi1 selectively targets meiotic transcripts for degradation via Pab2 and the exosome. Our findings have therefore uncovered a mode of gene regulation whereby a poly(A)-binding protein promotes RNA degradation in the nucleus to prevent untimely expression.
Figures


Similar articles
-
Cotranscriptional recruitment of the nuclear poly(A)-binding protein Pab2 to nascent transcripts and association with translating mRNPs.Nucleic Acids Res. 2009 Jun;37(10):3418-30. doi: 10.1093/nar/gkp207. Epub 2009 Mar 31. Nucleic Acids Res. 2009. PMID: 19336419 Free PMC article.
-
Selective elimination of messenger RNA prevents an incidence of untimely meiosis.Nature. 2006 Jul 6;442(7098):45-50. doi: 10.1038/nature04881. Nature. 2006. PMID: 16823445
-
YTH-RNA-binding protein prevents deleterious expression of meiotic proteins by tethering their mRNAs to nuclear foci.Elife. 2018 Feb 9;7:e32155. doi: 10.7554/eLife.32155. Elife. 2018. PMID: 29424342 Free PMC article.
-
The selective elimination of messenger RNA underlies the mitosis-meiosis switch in fission yeast.Proc Jpn Acad Ser B Phys Biol Sci. 2010;86(8):788-97. doi: 10.2183/pjab.86.788. Proc Jpn Acad Ser B Phys Biol Sci. 2010. PMID: 20948174 Free PMC article. Review.
-
[RNA-protein complex that governs meiosis in fission yeast].Tanpakushitsu Kakusan Koso. 2006 Dec;51(16 Suppl):2443-9. Tanpakushitsu Kakusan Koso. 2006. PMID: 17471961 Review. Japanese. No abstract available.
Cited by
-
RNA-Mediated Regulation of Meiosis in Budding Yeast.Noncoding RNA. 2022 Nov 15;8(6):77. doi: 10.3390/ncrna8060077. Noncoding RNA. 2022. PMID: 36412912 Free PMC article. Review.
-
Regulation of entry into gametogenesis.Philos Trans R Soc Lond B Biol Sci. 2011 Dec 27;366(1584):3521-31. doi: 10.1098/rstb.2011.0081. Philos Trans R Soc Lond B Biol Sci. 2011. PMID: 22084379 Free PMC article. Review.
-
Systematic analysis of the role of RNA-binding proteins in the regulation of RNA stability.PLoS Genet. 2014 Nov 6;10(11):e1004684. doi: 10.1371/journal.pgen.1004684. eCollection 2014 Nov. PLoS Genet. 2014. PMID: 25375137 Free PMC article.
-
The regulation and functions of the nuclear RNA exosome complex.Nat Rev Mol Cell Biol. 2016 Apr;17(4):227-39. doi: 10.1038/nrm.2015.15. Epub 2016 Jan 4. Nat Rev Mol Cell Biol. 2016. PMID: 26726035 Review.
-
A scaffold lncRNA shapes the mitosis to meiosis switch.Nat Commun. 2021 Feb 3;12(1):770. doi: 10.1038/s41467-021-21032-7. Nat Commun. 2021. PMID: 33536434 Free PMC article.
References
-
- Mata J., Lyne R., Burns G., Bähler J. (2002) Nat. Genet. 32, 143–147 - PubMed
-
- Averbeck N., Sunder S., Sample N., Wise J. A., Leatherwood J. (2005) Mol. Cell 18, 491–498 - PubMed
-
- Harigaya Y., Tanaka H., Yamanaka S., Tanaka K., Watanabe Y., Tsutsumi C., Chikashige Y., Hiraoka Y., Yamashita A., Yamamoto M. (2006) Nature 442, 45–50 - PubMed
Publication types
MeSH terms
Substances
Grants and funding
LinkOut - more resources
Full Text Sources
Molecular Biology Databases

