. 2010 Nov 15;182(10):1251-61.
doi: 10.1164/rccm.201004-0643OC. Epub 2010 Jul 9.

Loss of cystic fibrosis transmembrane conductance regulator function produces abnormalities in tracheal development in neonatal pigs and young children

Affiliations

Loss of cystic fibrosis transmembrane conductance regulator function produces abnormalities in tracheal development in neonatal pigs and young children

David K Meyerholz et al. Am J Respir Crit Care Med. .

Abstract

Rationale: Although airway abnormalities are common in patients with cystic fibrosis (CF), it is unknown whether they are all secondary to postnatal infection and inflammation, which characterize the disease.

Objectives: To learn whether loss of the cystic fibrosis transmembrane conductance regulator (CFTR) might affect major airways early in life, before the onset of inflammation and infection.

Methods: We studied newborn CFTR⁻(/)⁻ pig trachea, using computed tomography (CT) scans, pathology, and morphometry. We retrospectively analyzed trachea CT scans in young children with CF and also previously published data of infants with CF.

Measurements and main results: We discovered three abnormalities in the porcine CF trachea. First, the trachea and mainstem bronchi had a uniformly small caliber and cross-sections of trachea were less circular than in controls. Second, trachealis smooth muscle had an altered bundle orientation and increased transcripts in a smooth muscle gene set. Third, submucosal gland units occurred with similar frequency in the mucosa of CF and control airways, but CF submucosal glands were hypoplastic and had global reductions in tissue-specific transcripts. To learn whether any of these changes occurred in young patients with CF, we examined CT scans from children 2 years of age and younger, and found that CF tracheas were less circular in cross-section, but lacked differences in lumen area. However, analysis of previously published morphometric data showed reduced tracheal lumen area in neonates with CF.

Conclusions: Our findings in newborn CF pigs and young patients with CF suggest that airway changes begin during fetal life and may contribute to CF pathogenesis and clinical disease during postnatal life.


Figures
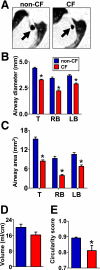
Figure 1.
Figure 1.
Computed tomography (CT) scan and morphometry of neonatal pig trachea. (A) Single slice images of trachea (arrows) from chest X-ray CT of non-CF (CFTR+/+; body weight, 1.42 kg) and CF (CFTR−/−; body weight, 1.47 kg) newborn pig littermates. (B) Airway lumen inner diameter and (C) lumen area measurements of trachea (T), right mainstem bronchus (RB), and left mainstem bronchus (LB) obtained from CT images of non-CF (CFTR+/+) and CF (CFTR−/−) newborn piglets (mean body weights, 1.4 ± 0.05 and 1.27 ± 0.1 kg, respectively; n = 4 per group; *P < 0.05 vs. non-CF). (D) Lung volume normalized to femur length was similar between groups. (E) Calculated circularity of cross-sectional trachea was reduced in CF pigs (P < 0.05, Mann-Whitney test).
Figure 2.
Figure 2.
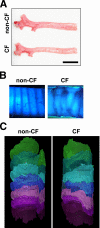
Gross appearance and three-dimensional volume-rendered optical frequency domain imaging of trachea. (A) Trachea and mainstem bronchi from newborn non-CF (CFTR+/−) and CF (CFTR−/−) littermates (body weight, 1.45 and 1.69 kg, respectively). CF pig tracheas were of small caliber (scale bar, 1.5 cm). (B) CF pig tracheas had irregular rings; alcian blue stain and illumination to show tracheal cartilage. (C) Three-dimensional volume-rendered optical frequency domain imaging of a tracheal segment from newborn non-CF (CFTR+/+) and CF (CFTR−/−) piglets. Individual cartilage rings (represented by different colors) in CF pigs appear to be more irregular and have variable width compared with controls.
Figure 3.
Figure 3.
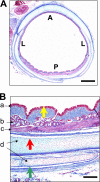
Morphologic landmarks for quantitative analysis of neonatal pig trachea. (A) Cross-sections of “whole trachea” were digitally captured at ×20 magnification and parameters were assessed for each trachea section. Anterior (A), posterior (P) and lateral (L) tracheal walls were identified. (B) Posterior trachea wall is highlighted by the borders of the lumen (yellow arrow), inner cartilage (red arrow), and outer cartilage (green arrow). Note also in this image the (a) surface epithelium, (b) submucosal glands, (c) trachealis muscle, and (d) the cartilage rings. Masson's trichrome stain. Scale bars: (A) 1 mm; (B) 160 μm.
Figure 4.
Figure 4.
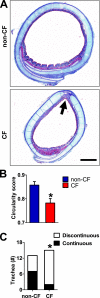
Cross-sections and morphometry of tracheas in newborn pig littermates. (A) CF (CFTR−/−) trachea lumens were smaller in cross-section compared with non-CF (CFTR+/+) tracheas, and sometimes had discontinuous gaps (arrow) in the cartilage rings on the anterior border (body weight, 1.6 kg, each), Masson's trichrome stain; scale bar, 1 mm. (B) CF pigs (n = 6) had reduced circularity in tracheal cross-sections compared with non-CF pigs (n = 6); P < 0.05, Mann-Whitney test. (C) Discontinuous cartilage was more frequently detected in CF (CFTR−/−, n = 15) versus non-CF (CFTR+/+, n = 13) tracheas. P < 0.05, Fisher's exact test.
Figure 5.
Figure 5.
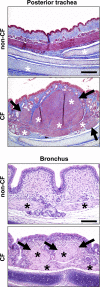
Trachea and bronchus wall from non-CF (CFTR+/+) and CF (CFTR−/−) neonatal pigs. Tracheal (top) and bronchial (bottom) smooth muscle (asterisks) was often accentuated as distinctive bundles (arrows). The CF panels represent a severe case, Masson's trichrome and hematoxylin–eosin stains. Scale bars: Top: 231 μm; bottom: 116 μm.
Figure 6.
Figure 6.
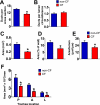
Submucosal gland morphometry in non-CF (CFTR+/+) and CF (CFTR−/−) neonatal pig littermates. (A and B) CF tracheas (n = 10) had a reduced number of submucosal gland ducts (A) in whole trachea cross-sections compared with non-CF (n = 10) tracheas, but had similar frequency (B) when normalized to trachea lumen circumference (P < 0.01 and not significant [NS], respectively, Mann-Whitney test). (C–E) Submucosal gland tissue area was reduced in CF (n = 14) versus non-CF (n = 10) whole trachea sections (C) and also when normalized to inner wall area (D) or lumen circumference (E) (P < 0.001, P < 0.05, and P < 0.05, respectively, Mann-Whitney test). (F) Posterior (P), anterior (A), and lateral (L) wall of trachea from non-CF (n = 9) and CF (n = 13) neonatal pigs. Representative images were consistently collected along the respective walls and the submucosal gland (SMG) area and normalized to the length of the lumen–wall interface. Submucosal glands had similar preferential distribution in both genotypes; however, CF tracheas had reduced submucosal gland area in each wall segment (P < 0.05, P < 0.001, and P < 0.01, respectively, Mann-Whitney test). Columns and error bars represent means ± SEM.
Figure 7.
Figure 7.
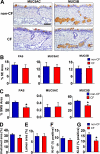
Histochemical and immunohistochemical staining and morphometry of tracheal tissues in neonatal pigs. (A) MUC5AC and MUC5B immunostaining of CF and non-CF trachea; scale bar, 58 μm. (B and C) Periodic acid–Schiff (PAS), MUC5AC, and MUC5B staining in trachea from non-CF (CFTR+/+, n = 9, 6, and 6, respectively) and CF (CFTR−/−, n = 13, 9, and 9, respectively) neonatal pigs was similar in surface epithelium (SE) (B), but in submucosal glands (SMG) (C) both PAS and MUC5B staining were reduced as a percentage of total submucosal gland area (P < 0.01 and P < 0.05, respectively, all others not significant [NS], Mann-Whitney test; columns and error bars, means ± SEM). (D and E) Cytokeratin-18 (CK18) staining and lumen area in submucosal glands from non-CF (CFTR+/+, n = 10) and CF (CFTR−/−, n = 12) neonatal pigs. CF pigs had reduced CK18 staining (D), but submucosal gland lumen area (E) was similar as a percentage of total submucosal gland area (P < 0.05 and NS, Mann-Whitney test; columns and error bars, means ± SEM). (F and G) Ki-67 immunohistochemical staining of trachea in non-CF (CFTR+/+, n = 16) and CF (CFTR−/−, n = 18) neonatal pigs was similar in the surface epithelium (SE) (F), but stained nuclei were significantly decreased in the submucosal glands (SMG) (G) as a percentage of total nuclei, (NS and P < 0.05, respectively, Mann-Whitney test; columns and error bars, means ± SEM).
Figure 8.
Figure 8.
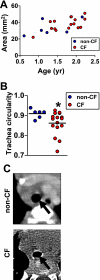
Tracheal morphometry from computed tomography (CT) images of trachea of children with CF (n = 16; mean age, 1.7 yr) and non-CF children (n = 6; mean age, 1.3 yr) 2 years of age and younger. (A) Trachea lumen area was not significantly different between groups. (B) CF tracheas were less circular than non-CF controls (P < 0.05, Mann-Whitney test; horizontal bars, means). (C) Representative CT scans of tracheas (arrows) of a non-CF infant and an infant with CF (0.6 and 0.8 yr, respectively) demonstrated less circular structure of the CF trachea.

References

    1. Riordan JR, Rommens JM, Kerem B, Alon N, Rozmahel R, Grzelczak Z, Zielenski J, Lok S, Plavsic N, Chou JL, et al. Identification of the cystic fibrosis gene: cloning and characterization of complementary DNA. Science 1989;245:1066–1073. - PubMed
    1. Welsh MJ, Ramsey BW, Accurso F, Cutting GR. Cystic fibrosis. In: Scriver CR, Beaudet AL, Sly WS, Valle D, Childs B, Vogelstein B, editors. The metabolic and molecular basis of inherited disease. New York: McGraw-Hill; 2001. pp. 5121–5189.
    1. Rowe SM, Miller S, Sorscher EJ. Cystic fibrosis. N Engl J Med 2005;352:1992–2001. - PubMed
    1. O'Sullivan BP, Freedman SD. Cystic fibrosis. Lancet 2009;373:1891–1904. - PubMed
    1. Martinez TM, Llapur CJ, Williams TH, Coates C, Gunderman R, Cohen MD, Howenstine MS, Saba O, Coxson HO, Tepper RS. High-resolution computed tomography imaging of airway disease in infants with cystic fibrosis. Am J Respir Crit Care Med 2005;172:1133–1138. - PMC - PubMed

Publication types

MeSH terms

Substances