. 2010 Jul;22(7):2253-64.
doi: 10.1105/tpc.110.075986. Epub 2010 Jul 9.

Crossovers get a boost in Brassica allotriploid and allotetraploid hybrids

Affiliations

Crossovers get a boost in Brassica allotriploid and allotetraploid hybrids

Martine Leflon et al. Plant Cell. 2010 Jul.

Abstract

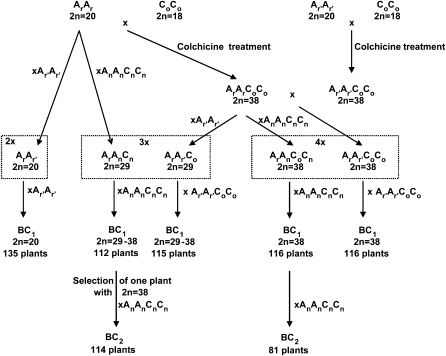
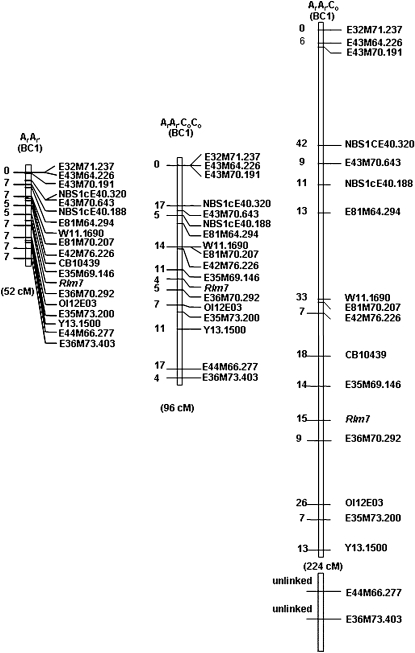
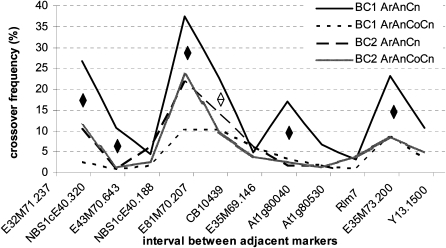
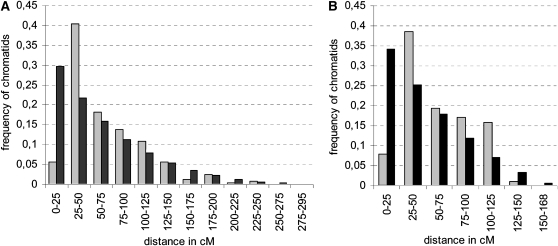
Meiotic crossovers are necessary to generate balanced gametes and to increase genetic diversity. Even if crossover number is usually constrained, recent results suggest that manipulating karyotype composition could be a new way to increase crossover frequency in plants. In this study, we explored this hypothesis by analyzing the extent of crossover variation in a set of related diploid AA, allotriploid AAC, and allotetraploid AACC Brassica hybrids. We first used cytogenetic methods to describe the meiotic behavior of the different hybrids. We then combined a cytogenetic estimation of class I crossovers in the entire genome by immunolocalization of a key protein, MutL Homolog1, which forms distinct foci on meiotic chromosomes, with genetic analyses to specifically compare crossover rates between one pair of chromosomes in the different hybrids. Our results showed that the number of crossovers in the allotriploid AAC hybrid was higher than in the diploid AA hybrid. Accordingly, the allotetraploid AACC hybrid showed an intermediate behavior. We demonstrated that this increase was related to hybrid karyotype composition (diploid versus allotriploid versus allotetraploid) and that interference was maintained in the AAC hybrids. These results could provide another efficient way to manipulate recombination in traditional breeding and genetic studies.


Figures

Figure 1.
Figure 1.
Schematic Detailing the Production of Hybrids and Segregating Backcross Populations. ArAr and Ar′Ar′ represent the C1.3 and Z1 B. rapa plants, respectively, CoCo designates the B. oleracea cultivars (RC and HDEM), and AnAnCnCn stands for the B. napus cv Darmor. The genomic structure of F1 hybrids is shown in dotted boxes (2x, 3x, or 4x for diploid, allotriploid, or allotetraploid, respectively).
Figure 2.
Figure 2.
MLH1 Immunolocalization in PMCs of the ArAr Diploid ([A][C]), ArAr′CoCo Allotetraploid ([D][F]), and ArAr′Co Allotriploid ([G][L]) Hybrids. Chromosomes at diakinesis stage were stained with DAPI (red) and the Arabidopsis MLH1 antibody (green). (C), (F), (I), and (L) were generated by merging DAPI and anti-MLH1. Arrows indicate multivalents, and asterisks show univalents. Bars = 10 μm.
Figure 3.
Figure 3.
Maps of the A7 Linkage Group in Progeny of the Diploid (ArAr′), Allotriploid (ArAr′Co), and Allotetraploid (ArAr′CoCo) Hybrids. Genetic distances, indicated on the left of the linkage group, are expressed in cM and represent the distance between the marker and the annotated marker immediately above.
Figure 4.
Figure 4.
Crossover Rates in Allotriploid and Allotetraploid Hybrids and BC1 Progeny along the A7 Linkage Group. Black diamonds indicate that the crossover frequency (as measured by the proportion of plants showing recombination for each interval) estimated in the BC1 progeny of ArAnCn differed from that estimated using any of the other three progeny. White diamonds indicate that crossover frequencies in the BC1 progeny of ArAnCn are significantly different from both BC1 and BC2 progeny of ArAnCnCn but not significantly different from the BC2 progeny of ArAnCn. See Figure 1 for BC1 progeny lineage. A False Discovery Rate correction was applied to account for pairwise multiple comparisons.
Figure 5.
Figure 5.
Distribution of the Distances between Adjacent Crossovers Expressed in cM. The histograms in black represent the theoretical distribution, which assumes that the positions of multiple (more than one) crossovers are independent from one another. The histogram in gray represents the observed distribution in the BC1 progeny of ArAr′Co (A) or ArAnCn (B) hybrids.

References

    1. Able J.A., Langridge P. (2006). Wild sex in the grasses. Trends Plant Sci. 11: 261–263 - PubMed
    1. Barth S., Melchinger A.E., Devezi-Savula B., Lubberstedt T. (2001). Influence of genetic background and heterozygosity on meiotic recombination in Arabidopsis thaliana. Genome 44: 971–978 - PubMed
    1. Brubaker C.L., Paterson A.H., Wendel J.F. (1999). Comparative genetic mapping of allotetraploid cotton and its diploid progenitors. Genome 42: 184–203
    1. Canady M.A., Ji Y., Chetelat R.T. (2006). Homeologous recombination in Solanum lycopersicoides introgression lines of cultivated tomato. Genetics 174: 1775–1788 - PMC - PubMed
    1. Carlton P.M., Farruggio A.P., Dernburg A.F. (2006). A link between meiotic prophase progression and crossover control. PLoS Genet. 2: 119–128 - PMC - PubMed

Publication types

LinkOut - more resources