. 2010 Sep;59(9):2134-44.
doi: 10.2337/db10-0233. Epub 2010 Jul 9.

Kinetics of contraction-induced GLUT4 translocation in skeletal muscle fibers from living mice

Affiliations

Kinetics of contraction-induced GLUT4 translocation in skeletal muscle fibers from living mice

Hans P M M Lauritzen et al. Diabetes. 2010 Sep.

Abstract

Objective: Exercise is an important strategy for the treatment of type 2 diabetes. This is due in part to an increase in glucose transport that occurs in the working skeletal muscles. Glucose transport is regulated by GLUT4 translocation in muscle, but the molecular machinery mediating this process is poorly understood. The purpose of this study was to 1) use a novel imaging system to elucidate the kinetics of contraction-induced GLUT4 translocation in skeletal muscle and 2) determine the function of AMP-activated protein kinase alpha2 (AMPKalpha2) in this process.

Research design and methods: Confocal imaging was used to visualize GLUT4-enhanced green fluorescent protein (EGFP) in transfected quadriceps muscle fibers in living mice subjected to contractions or the AMPK-activator AICAR.

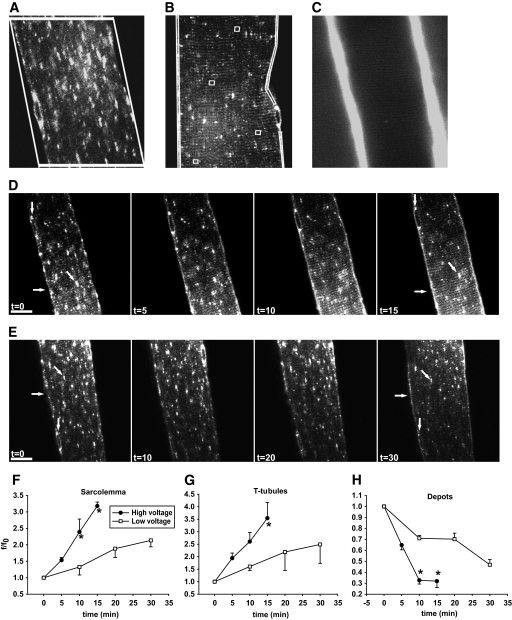
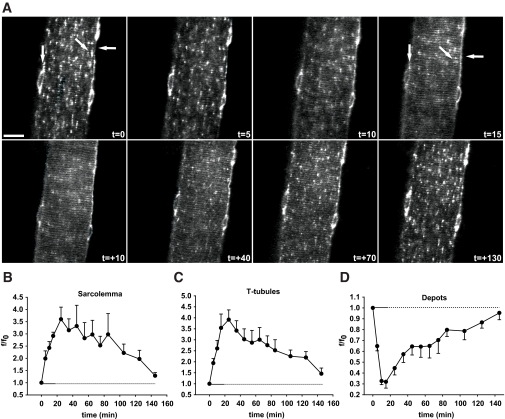
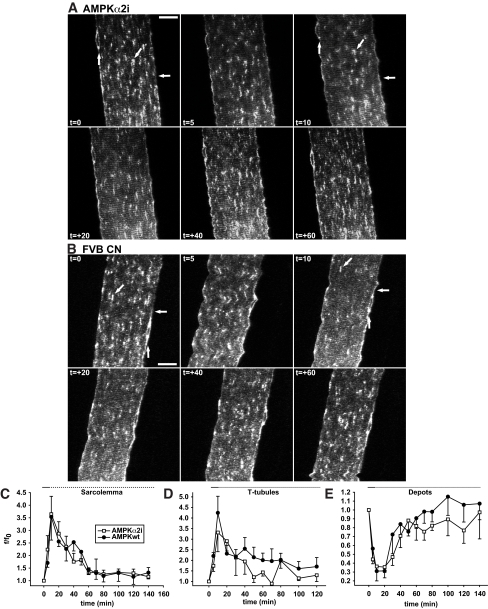
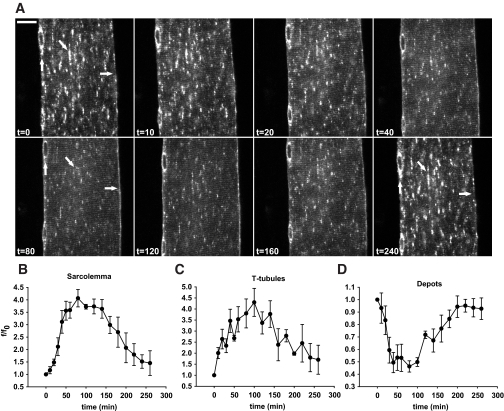
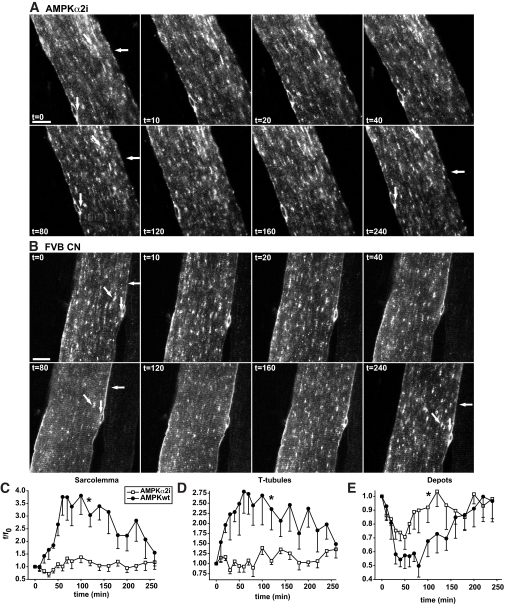
Results: Contraction increased GLUT4-EGFP translocation from intracellular vesicle depots to both the sarcolemma and t-tubules with similar kinetics, although translocation was greater with contractions elicited by higher voltage. Re-internalization of GLUT4 did not begin until 10 min after contractions ceased and was not complete until 130 min after contractions. AICAR increased GLUT4-EGFP translocation to both sarcolemma and t-tubules with similar kinetics. Ablation of AMPKalpha2 activity in AMPKalpha2 inactive transgenic mice did not change GLUT4-EGFP's basal localization, contraction-stimulated intracellular GLUT4-EGFP vesicle depletion, translocation, or re-internalization, but diminished AICAR-induced translocation.

Conclusions: We have developed a novel imaging system to study contraction-stimulated GLUT4 translocation in living mice. Contractions increase GLUT4 translocation to the sarcolemma and t-tubules with similar kinetics and do not require AMPKalpha2 activity.


Figures

FIG. 1.
FIG. 1.
Contraction-mediated GLUT4-EGFP translocation to both sarcolemma and t-tubules. A and B: Examples of the regions of interest (ROIs) used for image quantifications. A: Fluorescence values of GLUT4-EGFP perinuclear and nonperinuclear depots were measured within the same ROI. Quantification software settings were set to measure vesicles >2 μm in size inside the ROI and to discriminate between perinuclear and nonperinuclear depots. B: The level of GLUT4-EGFP translocation in the muscle fibers at the different time points was measured in ROIs along each sarcolemma side and in four randomly chosen ROIs in the t-tubules region. Translocation ROIs excluded vesicles structures above 2 μm in size. C: In vivo staining of t-tubules after intravenous injection of the water soluble dye sulforhodamine B, showing a high fluorescence staining in the capillaries running along the sarcolemma together with a more weakly fluorescent striated pattern in the t-tubules region. D and E: t = 0 shows confocal images of basal GLUT4-EGFP–expressing ICR mouse muscle fibers just before in situ contractions. Repeated single contractions (2 Hz) were elicited using either “high” (1.1–3 V) (D) or “low” (0.1–0.9 V) (E) voltage. Muscle was stimulated for 3 × 5 min (D) or 3 × 10 min (E) periods separated by 90 sec of rest. Images are shown from one muscle fiber subjected to either high- (D) or low-voltage (E) contractions. Horizontal arrows indicate sarcolemma, while GLUT4-EGFP depots are indicated near the nuclei by vertical arrows and inside the fiber by diagonal arrows. Similar observations were done in fibers from five to eight mice. Numbers denote time in min. Bars = 20 μm. F-H: Image quantifications of GLUT4-EGFP at the sarcolemma (F), the t-tubules (G), and the intracellular vesicle depots (H). *Statistical difference between groups (P < 0.05) in values obtained at the end of identical contraction bouts. Arbitrary units shown are the actual grey value of ROI fluorescence divided by ROI fluorescence value at t = 0 (f/f0). Data are means ± SE. n = 5–8.
FIG. 2.
FIG. 2.
In situ contractions induce GLUT4-EGFP translocation to and re-internalization from both sarcolemma and t-tubules with similar kinetics. A: t=0 shows confocal image of a basal GLUT4-EGFP–expressing muscle fiber just before in situ contractions in an ICR mouse. Contractions were elicited using the high-voltage protocol for 3 × 5 min separated by 90 sec of rest. Horizontal arrows indicate sarcolemma, while GLUT4-EGFP depots are indicated near the nuclei by vertical arrows and inside the fiber by diagonal arrows. Similar observations were done in fibers from five to eight mice. t = denotes accumulated contraction time; t = + denotes time during recovery after contractions. Bar = 20 μm. B-D: Image quantifications of GLUT4-EGFP at the sarcolemma (B), the t-tubules (C), and the intracellular vesicle depots (D). Horizontal solid lines indicate contraction period. Horizontal dotted lines indicate the period after contractions. Data are means ± SE. n = 5–8.
FIG. 3.
FIG. 3.
AMPK activity does not affect GLUT4-EGFP basal localization and translocation and re-internalization kinetics in response to in situ contractions. A and B: t = 0 shows confocal images of basal GLUT4-EGFP–expressing muscle fibers immediately before in situ contractions in either a muscle-specific AMPKα2 inactive transgenic mouse (A) or a matched control mouse (B). Contractions were elicited using the high-voltage protocol for 2 × 5 min separated by 90 sec of rest. Horizontal arrows indicate sarcolemma, while GLUT4-EGFP depots are indicated near the nuclei by vertical arrows and inside the fibers by diagonal arrows. Similar observations were made in fibers from five mice in each group. Numbers denote time in min during (t =) and after (t = +) contractions. Bars = 20 μm. C–E: Image quantifications of GLUT4-EGFP at the sarcolemma (C), the t-tubules (D), and the intracellular vesicle depots (E). Horizontal solid lines indicate contraction period. Horizontal dotted lines indicate the period after contractions. Data are means ± SE. n = 5.
FIG. 4.
FIG. 4.
AICAR stimulation induces GLUT4-EGFP translocation to both sarcolemma and t-tubules with similar kinetics. A: t = 0 shows a confocal image of a basal GLUT4-EGFP–expressing muscle fiber in situ immediately prior to intravenous AICAR administration via the tail vein of an anesthetized ICR mouse. Horizontal arrows indicate sarcolemma, while GLUT4-EGFP depots are indicated near the nuclei by vertical arrows and inside the fiber by diagonal arrows. Similar observations were made in fibers from five mice. Numbers denote time in min. Bar = 20 μm. B–D: Image quantifications of GLUT4-EGFP at the sarcolemma (B), the t-tubules (C), and the intracellular vesicle depots (D). Data are means ± SE. n = 5.
FIG. 5.
FIG. 5.
Depletion of AMPKα2 activity markedly reduces AICAR-mediated GLUT4-EGFP translocation to both the sarcolemma and t-tubules. A and B: t = 0 shows confocal images of a basal GLUT4-EGFP–expressing muscle fiber in situ in either an AMPKα2 inactive transgenic mouse (A) or a matched control FVB mouse (B). Immediately after t = 0, AICAR was administrated intravenously via the tail vein. Horizontal arrows indicate sarcolemma, while GLUT4-EGFP depots are indicated near the nuclei by vertical arrows and inside the fiber by diagonal arrows. Similar observations were made in fibers from five to six mice in each group. Numbers denote time in min. Bars = 20 μm. C–E: Image quantifications of GLUT4-EGFP at the sarcolemma (C), the t-tubules (D), and the intracellular vesicle depots (E). Area under curves were calculated. *Statistical difference between groups (P < 0.05). Data are means ± SE. n = 5–6.

Similar articles

Cited by

References

    1. Ferrannini E, Smith JD, Cobelli C, Toffolo G, Pilo A, DeFronzo RA. Effect of insulin on the distribution and disposition of glucose in man. J Clin Invest 1985;76:357–364 - PMC - PubMed
    1. Wilson CM, Cushman SW. Insulin stimulation of glucose transport activity in rat skeletal muscle: increase in cell surface GLUT4 as assessed by photolabelling. Biochem J 1994;299:755–759 - PMC - PubMed
    1. Marette A, Burdett E, Douen A, Vranic M, Klip A. Insulin induces the translocation of GLUT4 from a unique intracellular organelle to transverse tubules in rat skeletal muscle. Diabetes 1992;41:1562–1569 - PubMed
    1. Ploug T, van Deurs B, Ai H, Cushman SW, Ralston E. Analysis of GLUT4 distribution in whole skeletal muscle fibers: identification of distinct storage compartments that are recruited by insulin and muscle contractions. J Cell Biol 1998;142:1429–1446 - PMC - PubMed
    1. Lauritzen HP, Ploug T, Prats C, Tavaré JM, Galbo H. Imaging of insulin signaling in skeletal muscle of living mice shows major role of t-tubules. Diabetes 2006;55:1300–1306 - PubMed

Publication types

Substances