. 2010 Oct;59(10):2558-68.
doi: 10.2337/db10-0136. Epub 2010 Jul 9.

Mesenchymal stem cells enhance allogeneic islet engraftment in nonhuman primates

Affiliations

Mesenchymal stem cells enhance allogeneic islet engraftment in nonhuman primates

Dora M Berman et al. Diabetes. 2010 Oct.

Abstract

Objective: To test the graft-promoting effects of mesenchymal stem cells (MSCs) in a cynomolgus monkey model of islet/bone marrow transplantation.

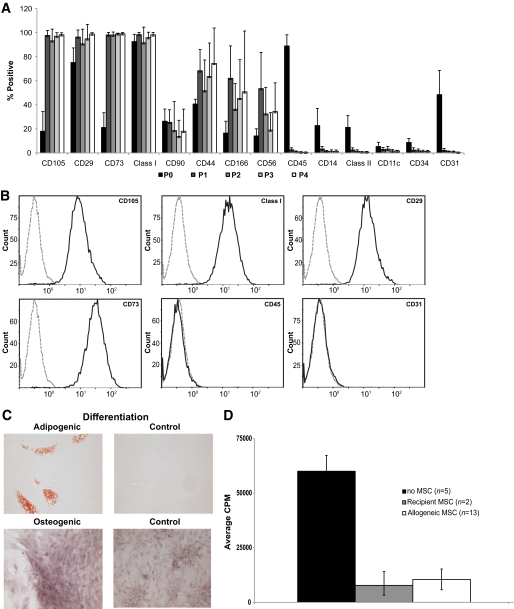
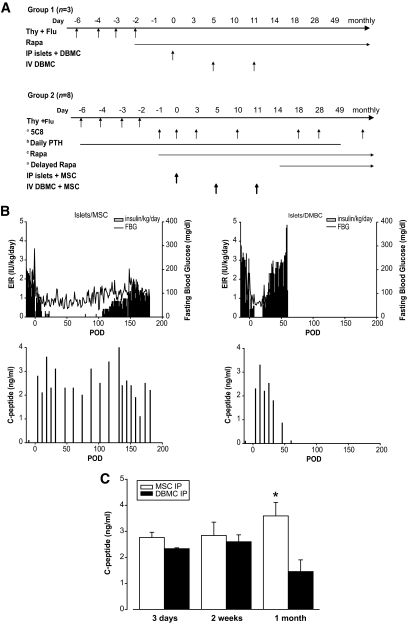
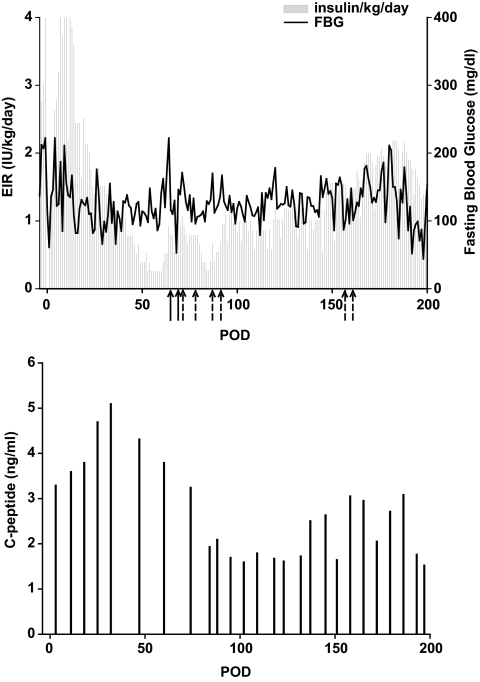
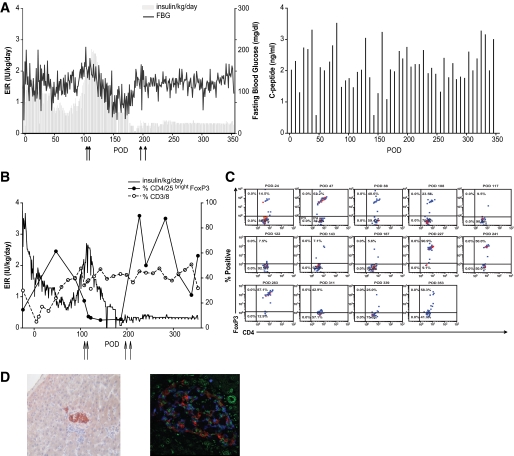
Research design and methods: Cynomolgus MSCs were obtained from iliac crest aspirate and characterized through passage 11 for phenotype, gene expression, differentiation potential, and karyotype. Allogeneic donor MSCs were cotransplanted intraportally with islets on postoperative day (POD) 0 and intravenously with donor marrow on PODs 5 and 11. Recipients were followed for stabilization of blood glucose levels, reduction of exogenous insulin requirement (EIR), C-peptide levels, changes in peripheral blood T regulatory cells, and chimerism. Destabilization of glycemia and increases in EIR were used as signs of rejection; additional intravenous MSCs were administered to test the effect on reversal of rejection.

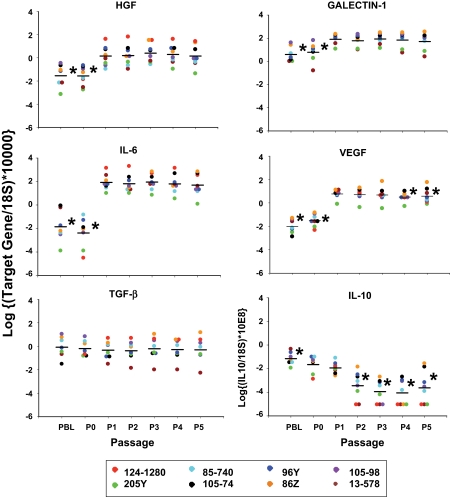
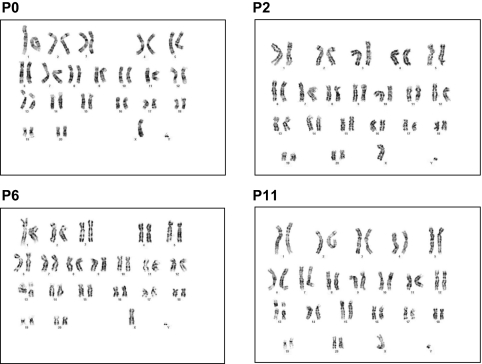
Results: MSC phenotype and a normal karyotype were observed through passage 11. IL-6, IL-10, vascular endothelial growth factor, TGF-β, hepatocyte growth factor, and galectin-1 gene expression levels varied among donors. MSC treatment significantly enhanced islet engraftment and function at 1 month posttransplant (n = 8), as compared with animals that received islets without MSCs (n = 3). Additional infusions of donor or third-party MSCs resulted in reversal of rejection episodes and prolongation of islet function in two animals. Stable islet allograft function was associated with increased numbers of regulatory T-cells in peripheral blood.

Conclusions: MSCs may provide an important approach for enhancement of islet engraftment, thereby decreasing the numbers of islets needed to achieve insulin independence. Furthermore, MSCs may serve as a new, safe, and effective antirejection therapy.


Figures

FIG. 1.
FIG. 1.
A: Phenotypic characterization of MSCs isolated from cynomolgus bone marrow. P0, aspirate; P1–P4, after first, second, third, and fourth trypsinization, respectively. Values represent mean ± SD, number of different donors for each passage in parentheses. P0 (n = 29); P1 (n = 25); P2 (n = 24); P3 (n = 14); and P4 (n = 9). B: Representative flow cytometric analysis of P2-cultured MSCs. Compared with isotype control (dashed lines), cynomolgus bone marrow MSCs stained positive for CD105, MHC class I, CD29, and CD 73 and negative for CD45 and CD31. Histograms represent consistent findings in 24 different donors. C: Adipogenic and osteogenic differentiation of MSCs (passage 2) isolated from cynomolgus bone marrow aspirates. D: Effect of MSCs on PHA-induced stimulation of PBMC proliferation. Allogeneic MSCs significantly inhibited PBMC proliferation by 85% (P < 0.009); results for autologous cells were similar, but too few donors were tested to assess statistical significance. CPM, counts per minute. (A high-quality color representation of this figure is available in the online issue.)
FIG. 2.
FIG. 2.
Gene expression levels for IL-6, IL-10, VEGF, TGF-β, HGF, and galectin-1 for sequential passages from eight cynomolgus monkey donors. All results were expressed as the log ratio of the copy number of the target gene to the copy number of 18S (used as the endogenous control gene). Gene expression levels for PBL, P0, and P2–P5 were compared with levels expressed in P1 MSCs. n = 8, *P < 0.05 versus P1.
FIG. 3.
FIG. 3.
Trypsin-Giemsa banded karyotypes for MSCs from animal 105-74 from passages 0, 2, 6, and 11 showing a 42,XY normal male Pearson classification (52).
FIG. 4.
FIG. 4.
A: Schematic of the design used to test the effect of intraportal codelivery of islets with DBMCs (group 1) or with donor MSCs (group 2) on chimerism and islet graft survival in two groups of animals. Animals in group 1 received induction therapy consisting of four doses of thymoglobulin (Thy) and four doses of fludarabine (Flu) on PODs −6, −4, −3, and −2. IM rapamycin (Rapa) was initiated on POD −2. Islets were cotransplanted with DBMCs intraportally on POD 0, followed by intravenous (IV) infusions of DBMCs on PODs 5 and 11. Animals in group 2 received the same induction therapy with Thy and Flu. aanti-CD154 (5C8) on PODs −1, 0, 3, 10, 18, 28, and monthly thereafter, and rapamycin was initiated on POD 14 (n = 3). bPTH from POD −7 or −6 until POD 49 (n = 6). cRapamycin was initiated on POD −1 (n = 5). B: EIR, fasting blood glucose (FBG) (upper panel) and fasting C-peptide (lower panel) for representative animals from group 1 and group 2 that received similar numbers of islets. Both animals received induction therapy with thymoglobulin and fludarabine in the week prior to transplant and IM rapamycin starting on POD −1. The animal from group 1 (105-111, panel on the right) was transplanted with 11,598 IEQ/kg and 0.1 × 10⁹ DBMC/kg from a mismatched donor into the liver on POD 0, followed by intravenous DBMCs (0.33 × 10⁹ cells/kg) on PODs 5 and 11. The animal from group 2 (35-493, panel on the left) was transplanted with 10,978 IEQ/kg and 1.4 × 10⁶ MSCs/kg from a mismatched donor into the liver on POD 0, followed by IV donor MSCs (5.8 × 10⁶ cells/kg) together with CD11b depleted DBMCs (0.30 × 10⁹ cells/kg) on PODs 5 and 11. C: Fasting C-peptide levels for recipients of allogeneic islets in the liver at 3 days, 2 weeks, and 1 month posttransplant. Empty bars represent recipients of islet + MSC codelivery in the liver and delayed IV DBMC + MSC infusion (n = 8; group 2, Table 2). Black bars represent recipients of islet + DBMC codelivery in the liver and delayed IV DBMC infusion (n = 3; group 1, Table 1); *P = 0.043 at 1 month posttransplant.
FIG. 5.
FIG. 5.
EIR and fasting blood glucose (FBG) (upper panel) and fasting C-peptide (lower panel) for animal 26-20. This animal received induction therapy with thymoglobulin and fludarabine in the week prior to transplant, and IM rapamycin was initiated on POD 14 to achieve and maintain trough levels of 15–20 ng/ml. In addition, treatment with anti-CD154 (20 mg/kg) started on POD −1, with five doses in the first month posttransplant and monthly thereafter until POD 168. On POD 0, 3,928 IEQ/kg and 1.6 × 10⁶ MSCs/kg from a mismatched donor were transplanted into the liver. IV donor MSC (5.3 × 10⁶ cells/kg), together with CD11b depleted donor bone marrow cells (0.20 × 10⁹ cells/kg) were given on PODs 5 and 11. Additional donor MSCs (full arrow, 2 × 10⁶ cells/kg) were given on PODs 64 and 68, and third-party MSCs from a haploidentical third party (dashed arrow, 2 × 10⁶ cells/kg) were given on PODs 71, 77, 86, 91,155, and 160.
FIG. 6.
FIG. 6.
A: EIR and fasting blood glucose (FBG) (left panel) and fasting C-peptide (right panel) for animal 105-131. This animal received induction therapy with thymoglobulin and fludarabine in the week prior to transplant, and IM rapamycin was initiated on POD 14 to achieve and maintain trough levels of 15–20 ng/ml. In addition, treatment with anti-CD154 (20 mg/kg) started on POD −1, with five doses in the first month posttransplant and monthly thereafter. On POD 0, 3,000 IEQ/kg and 1.0 × 10⁶ MSCs/kg from a haploidentical donor were transplanted into the liver. IV donor MSCs (3.4 × 10⁶ cells/kg), together with CD11b depleted DBMCs (0.17 × 10⁹ cells/kg) were given on PODs 5 and 11. Additional donor MSCs (full arrow, 2 × 10⁶ cells/kg) were given on PODs 105, 110, 196, and 207. B: EIR (line), % CD4/25 bright FoxP3 T-cells (filled circles), and %CD3/8 positive T-cells (empty circles) for animal 105-131. Arrows indicate donor MSCs (2 × 10⁶ cells/kg) given on PODs 105, 110, 196, and 207. C: Frequency of FoxP3 positive T-cells in peripheral blood of animal 105-131 gated for CD3+CD4+CD25bright lymphocytes. D: Histopathology of liver sections after necropsy. Left panel shows immunohistochemistry staining of an islet with hematoxylin and eosin and positive signal for insulin (brown) (×200). Right panel shows a representative confocal microscopy analysis with immunofluorescence for insulin (red), glucagon (blue), and blood vessels (green) (×400). (A high-quality digital representation of this figure is available in the online issue.)

References

    1. Uccelli A, Moretta L, Pistoia V. Mesenchymal stem cells in health and disease. Nat Rev Immunol 2008;8:726–736 - PubMed
    1. Pittenger MF, Mackay AM, Beck SC, Jaiswal RK, Douglas R, Mosca JD, Moorman MA, Simonetti DW, Craig S, Marshak DR. Multilineage potential of adult human mesenchymal stem cells. Science 1999;284:143–147 - PubMed
    1. Bartholomew A, Sturgeon C, Siatskas M, Ferrer K, McIntosh K, Patil S, Hardy W, Devine S, Ucker D, Deans R, Moseley A, Hoffman R. Mesenchymal stem cells suppress lymphocyte proliferation in vitro and prolong skin graft survival in vivo. Exp Hematol 2002;30:42–48 - PubMed
    1. Di Nicola M, Carlo-Stella C, Magni M, Milanesi M, Longoni PD, Matteucci P, Grisanti S, Gianni AM. Human bone marrow stromal cells suppress T-lymphocyte proliferation induced by cellular or nonspecific mitogenic stimuli. Blood 2002;99:3838–3843 - PubMed
    1. Krampera M, Glennie S, Dyson J, Scott D, Laylor R, Simpson E, Dazzi F. Bone marrow mesenchymal stem cells inhibit the response of naive and memory antigen-specific T cells to their cognate peptide. Blood 2003;101:3722–3729 - PubMed

Publication types

MeSH terms