. 2010 Aug;6(8):587-94.
doi: 10.1038/nchembio.396. Epub 2010 Jul 11.

Time-resolved FRET between GPCR ligands reveals oligomers in native tissues

Affiliations

Time-resolved FRET between GPCR ligands reveals oligomers in native tissues

Laura Albizu et al. Nat Chem Biol. 2010 Aug.

Abstract

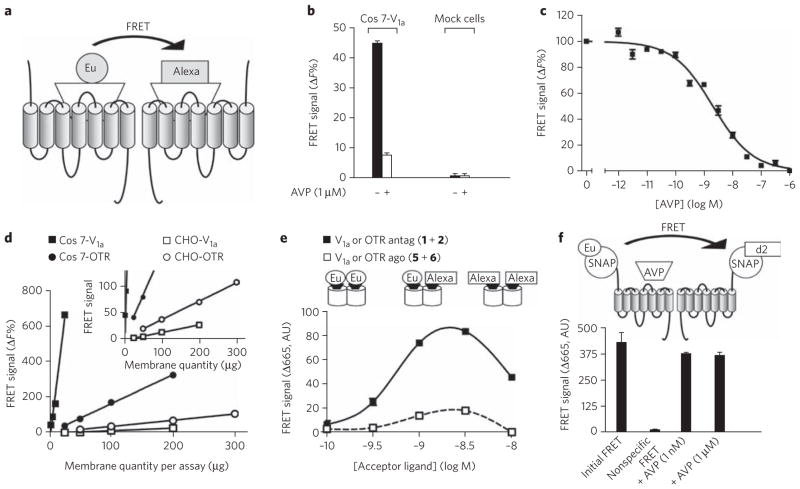
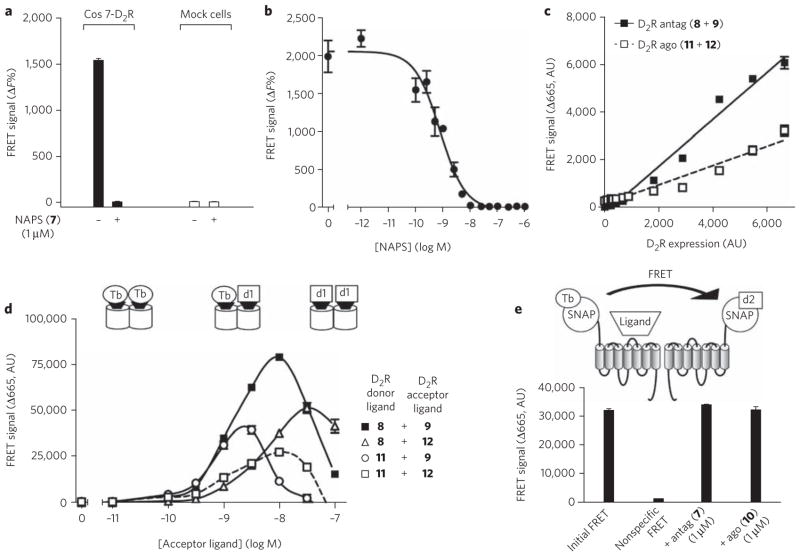
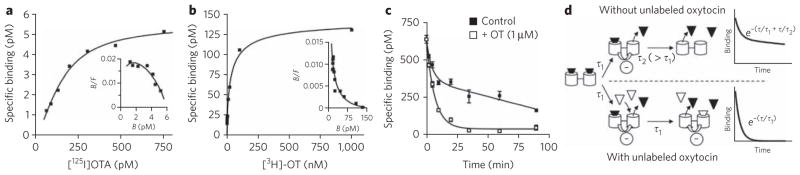
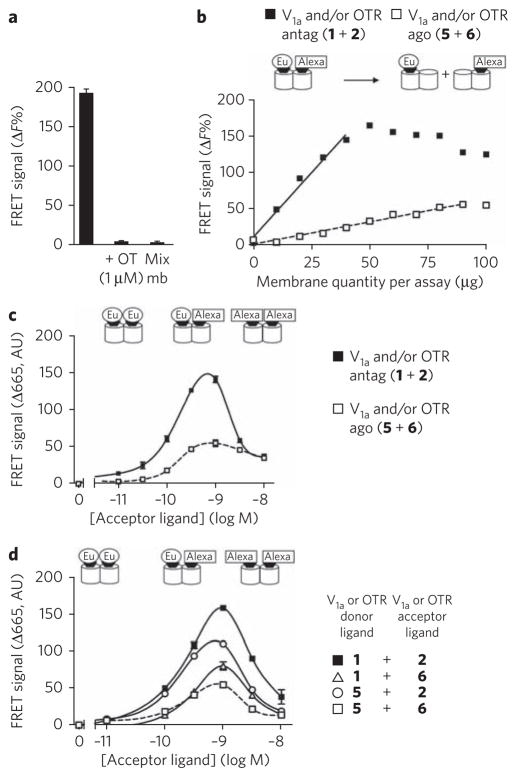
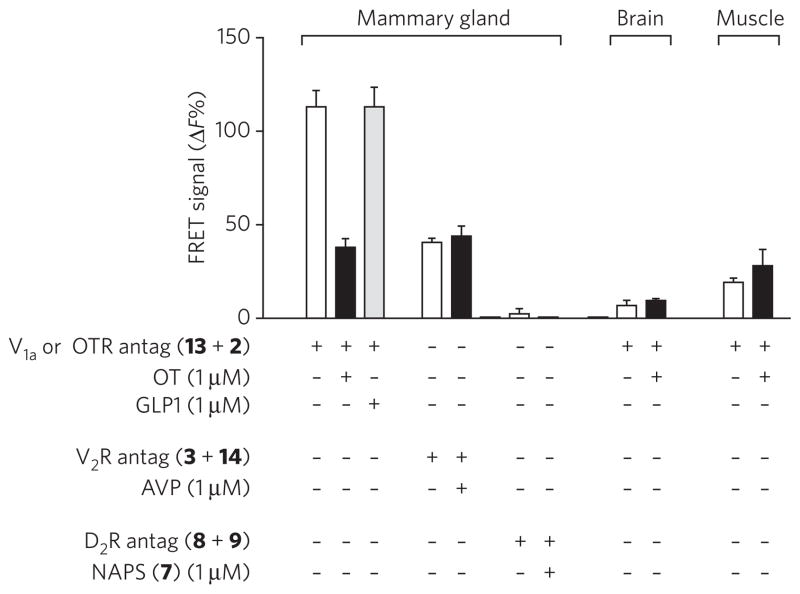
G protein-coupled receptor (GPCR) oligomers have been proposed to play critical roles in cell signaling, but confirmation of their existence in a native context remains elusive, as no direct interactions between receptors have been reported. To demonstrate their presence in native tissues, we developed a time-resolved FRET strategy that is based on receptor labeling with selective fluorescent ligands. Specific FRET signals were observed with four different receptors expressed in cell lines, consistent with their dimeric or oligomeric nature in these transfected cells. More notably, the comparison between FRET signals measured with sets of fluorescent agonists and antagonists was consistent with an asymmetric relationship of the two protomers in an activated GPCR dimer. Finally, we applied the strategy to native tissues and succeeded in demonstrating the presence of oxytocin receptor dimers and/or oligomers in mammary gland.


Conflict of interest statement

Competing financial interests

The authors declare competing financial interests: details accompany the full-text HTML version of the paper at http://www.nature.com/naturechemicalbiology/.

Figures

Figure 1
Figure 1. FRET signal between antagonists bound to V1a or oxytocin receptors expressed in heterologous expression systems
(a) Diagram illustrating the principle of FRET between ligands bound to GPCRs. (b) FRET signal observed on Cos7 cells transiently transfected with V1a receptors or on mock cells and labeled with [Lys(Eu–PBBP)]PVA (1) (1.4 nM) and [Lys(Alexa-647)]PVA (2) (0.7 nM) in the absence or presence of an excess of AVP (1 μM). (c) Inhibition of the FRET signal by increased concentrations of AVP (IC50 = 2.10 ± 0.2 nM). (d) Influence of the amount of receptor on the FRET signal. Experiments were performed with membrane preparation of Cos7 cells or on stable CHO cell lines expressing V1a or oxytocin receptors. Inset: same data at a different scale. (e) Variations in the FRET signal on membranes from oxytocin receptor (OTR)–expressing CHO cells as a function of ligand concentration. Donor ligands [Lys(Eu–PBBP)]PVA (1) and HO-[Thr,Orn(Eu–PBBP)]VT (5) were used at 1.5 nM, with increasing concentrations of acceptor ligands ([Lys(Alexa-647)]PVA (2) (black symbols) and HO-[Thr,Orn(Alexa-647)]VT (6) (white symbols)). (f) Effect of AVP (1 nM or 1 μM) on the FRET signal measured on Snap-tag–vasopressin V1a fusion receptors. Cells were incubated in the presence of benzyl guanine conjugated with europium cryptate (BG-K) (0.3 μM) and d2 (0.5 μM). Negative control has been provided by incubation of membranes with BG-K (0.3 μM) and unlabeled benzyl guanine (0.5 μM). Illustrated data are representative of at least three independent experiments performed in triplicate. Values correspond to the mean ± s.e.m. AU, arbitrary units.
Figure 2
Figure 2. FRET signal between antagonists bound to dopamine D2 receptors expressed in heterologous expression systems
(a) FRET signal observed on Cos7 cells transiently transfected with D2 receptors or on mock cells and labeled with NAPS(Lumi4-Tb) (8) (1 nM) and NAPS(d1) (9) (5 nM) in the absence or presence of an excess of NAPS (7) (1 μM). (b) Inhibition of the FRET signal by increasing concentrations of NAPS (IC50 = 1.9 ± 0.9 nM). (c) Effect of the variation of receptor density in Cos7 cells on the FRET signal between either the fluorescent antagonists NAPS(Lumi4-Tb) (8) (1 nM) and NAPS(d1) (9) (5 nM) (black squares) or the fluorescent agonists PPHT(Lumi4-Tb) (11) (7 nM) and PPHT(d1) (12) (5 nM) (white squares). (d) Comparison of FRET signals obtained with the various pairs of dopamine D2 receptor ligands. Donor ligands, NAPS(Lumi4-Tb) (8) and PPHT(Lumi4-Tb) (11), were used at 1 nM and 7 nM, respectively. Acceptor ligand corresponds either to NAPS(d1) (9) or PPHT(d1) (12). (e) Effect of NAPS (1 μM) or PPHT (1 μM) on the stability of the FRET signal measured on dopamine D2 receptor fused at its N terminus to the Snap-tag sequence. Cells were incubated in the presence of benzyl guanine conjugated with Lumi4-Tb (BG-Lumi4-Tb) (100 nM) and d2 (BG-d2) (250 nM). Negative control has been provided by incubation of cells in the absence of benzyl guanine conjugated with acceptor. Illustrated data are representative of at least three independent experiments performed in triplicate. Values correspond to the mean ± s.e.m. AU, arbitrary units.
Figure 3
Figure 3. Binding experiments on the oxytocin receptor expressed in membrane preparations from native tissue
(a, b) Saturation curves and the associated Scatchard plot (insets) obtained with the antagonist [125I]OTA and [3H]OT. The best fits with the Hill equation gave a Hill coefficient of 1.4 (a) and 0.54 (b). Experiments were performed on native tissues expressing oxytocin receptors (preparation of fetal membrane (a) and mammary gland preparation (b)). (c) Dissociation kinetics in the absence or presence of an excess of oxytocin; the fits correspond to a two-phase exponential decay (2.7 ± 0.3 min and 71 ± 16 min) and to a one-phase exponential decay (5.48 ± 0.59 min), respectively. (d) Diagram illustrating the influence of an excess of unlabeled oxytocin (white triangle) on the dissociation kinetics of [3H]OT (black triangle). Dissociation of receptor dimer–ligand complex follows a two-phase exponential decay with the time constants τ1 and τ2. In the absence of unlabeled ligand, owing to the negative cooperativity, the dissociation of the first ligand is faster than that of the second ligand (τ1 < τ2). The addition of an excess of unlabeled ligand does not affect the dissociation constant of the first ligand (time constant τ1) but promotes the dissociation of the second labeled ligand. Indeed, because of the negative cooperativity, the binding of unlabeled ligand on the second protomer increases the dissociation of the first labeled ligand (τ2 = τ1). Illustrated data are representative of at least three independent experiments performed in triplicate. Values correspond to the mean ± s.e.m.
Figure 4
Figure 4. FRET signals between fluorescent antagonists or agonists bound to native oxytocin receptors expressed in rat mammary glands
(a) Membrane preparations were labeled with [Lys(Eu-PBBP)]PVA (1) (1 nM) and [Lys(Alexa-647)]PVA (2) (1 nM). To produce negative controls, an excess of oxytocin (1 μM) was added or membrane samples labeled with either ligand 1 or 2 were mixed (Mix mb). Notably, membrane samples were mixed just before the reading of the fluorescent signal. (b) Effect of membrane quantity of lactating rat mammary gland on the FRET signals measured between fluorescent agonists (5 and 6) (1 nM) (white squares) compared to those obtained with antagonists (1 and 2) (1 nM) (black squares). (c) Variation in the FRET signal as a function of antagonist (black squares) or agonist (white squares) concentration. Donor ligands [Lys(Eu-PBBP)]PVA (1) and HO-[Thr,Orn(Eu-PBBP)]VT (5) were used at 1.2 nM and 1.5 nM, respectively. (d) Comparison of FRET signals obtained with the various pairs of ligands. Donor ligands were used at 1 nM. Acceptor ligand corresponds either to ([Lys(Alexa-647)]PVA (2); black squares and white circles) or (HO-[Thr,Orn(Alexa-647)]VT (6); white squares or triangles). Illustrated data are representative of at least three independent experiments performed in triplicate. Values correspond to the mean ± s.e.m. AU, arbitrary units.
Figure 5
Figure 5. FRET experiments performed on patches of native tissues
Mammary gland, brain and skeletal muscle patches were incubated in the presence of ligands as indicated. Illustrated data are representative of at least three independent experiments performed in dodecaplicate (mammary gland) or triplicate. Values correspond to the mean ± s.e.m.

Comment in

  • Microscopy: GPCR dimers moving closer.
    Ambrosio M, Lohse MJ. Ambrosio M, et al. Nat Chem Biol. 2010 Aug;6(8):570-1. doi: 10.1038/nchembio.409. Nat Chem Biol. 2010. PMID: 20644543 No abstract available.

References

    1. Terrillon S, Bouvier M. Roles of G-protein-coupled receptor dimerization. EMBO Rep. 2004;5:30–34. - PMC - PubMed
    1. Ferré S, et al. Building a new conceptual framework for receptor heteromers. Nat Chem Biol. 2009;5:131–134. - PMC - PubMed
    1. Fotiadis D, et al. Structure of the rhodopsin dimer: a working model for G-protein-coupled receptors. Curr Opin Struct Biol. 2006;16:252–259. - PubMed
    1. Gomes I, et al. A role for heterodimerization of mu and delta opiate receptors in enhancing morphine analgesia. Proc Natl Acad Sci USA. 2004;101:5135–5139. - PMC - PubMed
    1. Wreggett KA, Wells JW. Cooperativity manifest in the binding properties of purified cardiac muscarinic receptors. J Biol Chem. 1995;270:22488–22499. - PubMed

Publication types

MeSH terms