

doi: 10.1038/nmeth.1478.
Epub 2010 Jul 11.
Genome-wide chromatin maps derived from limited numbers of hematopoietic progenitors
Affiliations
- PMID: 20622861
- PMCID: PMC2924612
- DOI: 10.1038/nmeth.1478
Item in Clipboard
Genome-wide chromatin maps derived from limited numbers of hematopoietic progenitors
Nat Methods.
2010 Aug.
Abstract
Current methods for whole-genome mapping of protein-DNA interactions, performed by coupling chromatin immunoprecipitation with high-throughput sequencing (ChIP-seq), require large amounts of starting materials, which precludes their application to rare cell types. Here we combine a high-sensitivity ChIP assay with a new library preparation procedure to map histone modifications in as few as 10,000 cells. We used the technique to characterize mouse hematopoietic progenitors and thereby gain insight into their developmental program.
Conflict of interest statement
The authors declare competing financial interests: M.A. and B.E.B. have filed a patent application describing the methods presented here.
Figures

(a) Schematic of ChIP-Seq library preparation for low cell numbers. Universal PCR sequence (orange), restriction site (gray) and random 9-mer (blue) are indicated. (b) qPCR data for H3K4me3 ChIP-Seq libraries from indicated cell numbers. Bar graph shows relative enrichments at four gene promoters with H3K4me3 in ES cells. Data are normalized against an intergenic control region on chromosome 18. Error bars indicate s.e.m. based on 3 experimental replicates
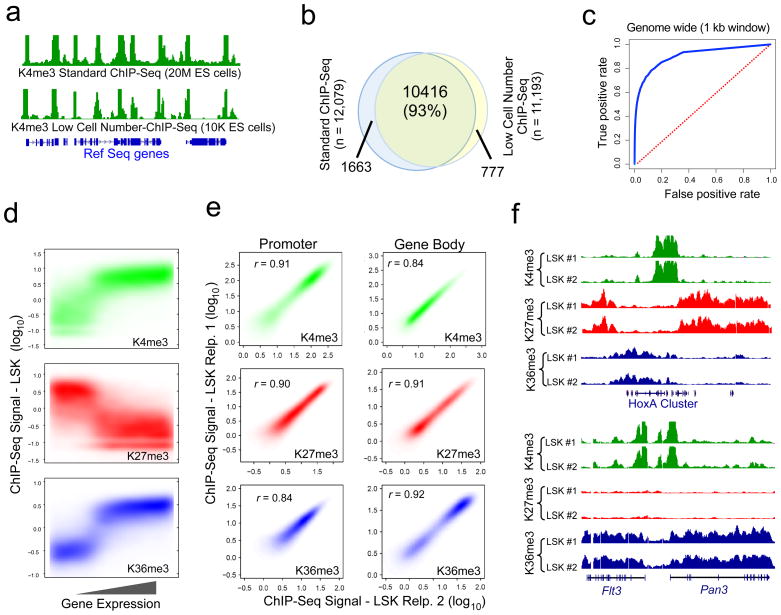
(a) K4me3 H3K4me3 in ES cells. Data are normalized against an intergenic control region on chromosome 18. Error bars indicate s.e.m. based on 3 experimental replicates.profiles are compared across a 50 kb region on the second chromosome. (b) Venn diagram shows overlap between H3K4me3-marked promoters. (c) Receiver operating characteristic (ROC) curve shows true-positive and false-positive rates for H3K4me3 low cell number ChIP-Seq data, evaluated for 1 kb windows across the genome, using the standard H3K4me3 ChIP-Seq dataset as a gold standard. Dotted red line indicates X = Y. (also see Supplementary Figure 6 & 7). (d) Chromatin maps from 20,000 LSK cells in biological replicate. Contour plots depict correlations between promoter (H3K4me3, H3K27me3) or gene body (H3K36me3) methylation levels and mRNA expression in LSKs. Each datapoint corresponds to a single gene. (e) Contour plots depict correlations between LSK replicates across gene promoters as well as gene bodies. (f) H3K4me3, H3K27me3 and H3K36me3 signal tracks for the independent LSK replicates are shown for the HoxA cluster and the Flt3 locus. The Y-axis of each profile represents the estimated number of ChIP fragments at each position normalized by the total number of reads in a given dataset. RefSeq gene annotations are also shown.

(a) LSKs have large H3K4me3 domains that mark hematopoietic regulators and punctate peaks at most other promoters. (b) Histogram with the size distribution of H3K4me3 intervals associated with gene promoters in LSKs; the high end of the size distribution is enriched for key hematopoietic regulators. (c,d) ChIP-Seq signal tracks for ES cells and LSKs across Zfp608 and Zeb2 (c) and Lef1 and Sox3 (d). (e) Heat map of genes with H3K27me3 and variable levels of H3K4me3 in LSKs, depicts their expression levels in different hematopoietic cell types (blue indicates low expression; red indicates high expression). The number of cell types in which a gene is expressed is plotted vertically in the right panel.
Comment in
-
Going small is the new big.Nat Methods. 2010 Aug;7(8):597, 599-600. doi: 10.1038/nmeth0810-597. Nat Methods. 2010. PMID: 20676079 No abstract available.
References
-
- O’Neill LP, VerMilyea MD, Turner BM. Nat Genet. 2006;38:835–841. - PubMed
Publication types
MeSH terms
Substances
Associated data
- Actions
Grants and funding
LinkOut - more resources
Full Text Sources
Other Literature Sources
Medical
Molecular Biology Databases
